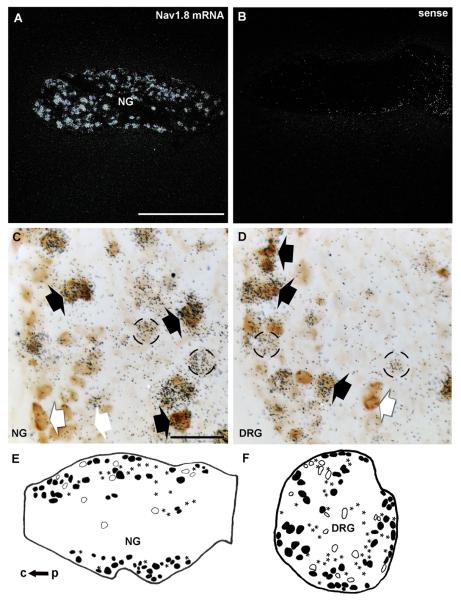
Figure 4.
Double ISH/IHC labeling for Nav1.8 mRNA and GFP. Robust hybridization signal (darkfield) for Nav1.8 mRNA is visible in the NG (A). By contrast, the sense probe reveals no significant signal (B). GFP-positive profiles (brown) are frequently overlaid by black silver grains, which indicate Nav1.8 mRNA expression in both the NG (C) and DRG (D). Black arrows show examples of double-labeled neurons, whereas white arrows show profiles solely GFP positive, and circles highlight Nav1.8-expressing cells only. Camera lucida drawings showing the typical distribution of profiles only positive for GFP (open profiles), only for Nav1.8 (asterisks), or double-labeled (black profiles) in a representative NG (E) and DRG (F). c, central end; p, peripheral end. Scale bars = 500 μm in A; 50 μm in C,D.

