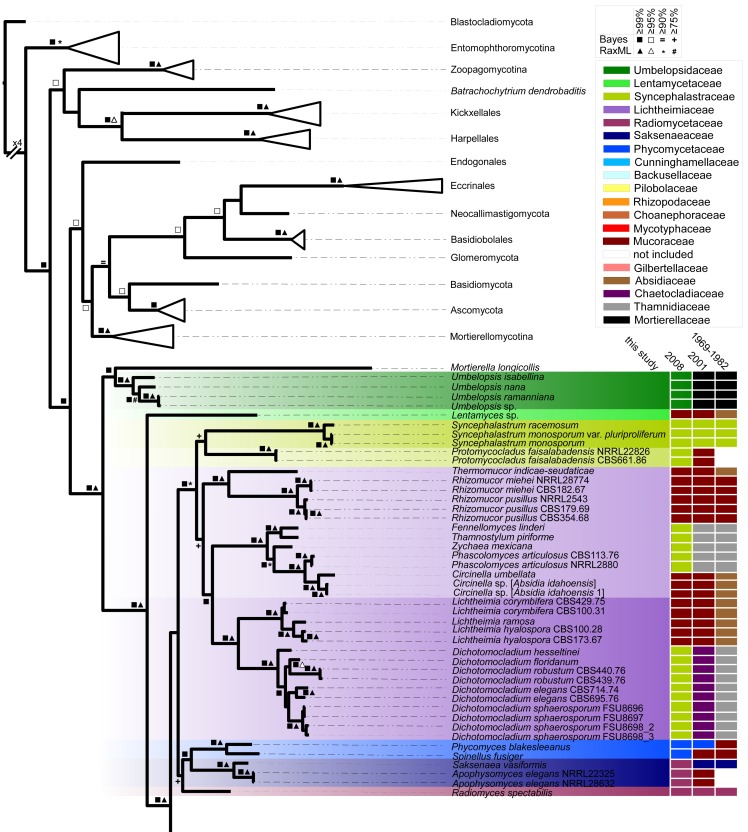
Fig. 10.
Bayesian analysis of combined sequences coding for actin, translation elongation factor 1-alpha, 18S rDNA and 28S rDNA. Bootstrap values and posterior probabilities are given for branches supported with equal or higher than 75 % in maximum likelihood (RAxML) and Bayesian analysis (see legend within figure for explanation of the symbols). Strain numbers are given in parts to distinguish different isolates (compare with Table 5). Furthermore, a rough outline about the historical family structures and changes are given on the right site including benchmark studies since 1969 (Zycha et al. 1969, Hesseltine & Ellis 1973, Benjamin 1979, Benny 1982, von Arx 1982, Benny et al. 2001, Voigt & Wöstemeyer 2001, O’Donnell et al. 2001, Kirk et al. 2008). Families accepted here, are colour coded over the whole tree branches.


