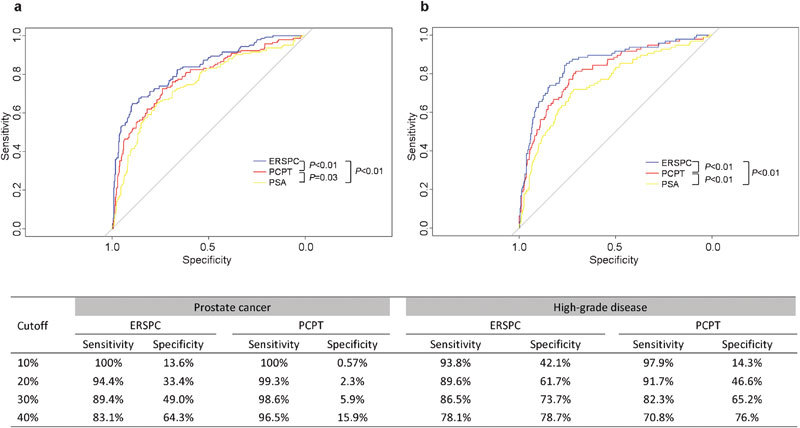
Figure 1.

ROC curves of the risk calculators and the PSA threshold of 4 ng ml−1 for prostate cancer (a) and high-grade disease (b) in the validation cohort (n=495). Pairwise comparisons of ROC curves are shown in the bottom-right corner of the figure. The table displays the sensitivity and specificity of each risk calculators at different cut-offs. For example, using the ERSPC risk calculator in this cohort, a cut-off of 30% corresponds to a sensitivity of 89.4% and a specificity of 49.0% in detecting prostate cancer. ERSPC, European Randomized Study of Screening for Prostate Cancer; PSA, prostate-specific antigen; ROC, receiver operating characteristic.
