
Figure 2.
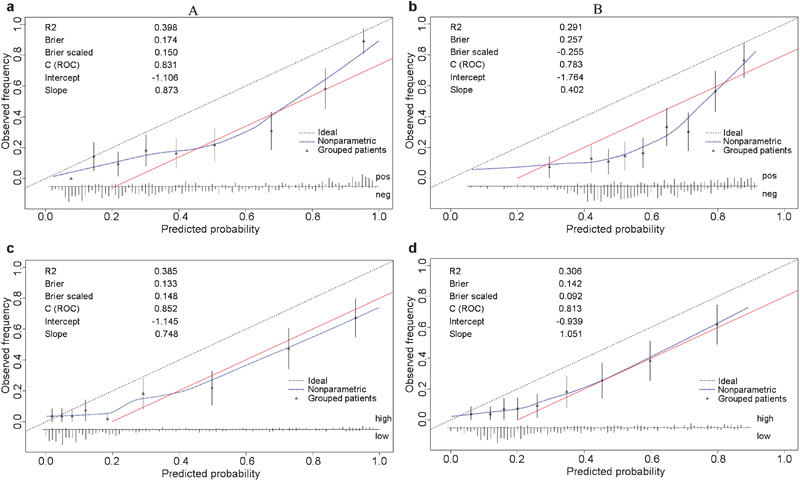
Calibration plots of the risk calculators in the validation cohort (n=495): ERSPC (a) and PCPT (b) risk calculators for prostate cancer; ERSPC (c) and PCPT (d) risk calculator for high-grade disease. The 45° dashed line represents an ideal prediction, in which the predicted and actual probabilities are identical. The actual performance of each risk calculator is represented by the blue dotted line. The red solid line indicates that the predicted risk was 20% higher than the observed probability. The spike histogram at the bottom of the figure shows the distribution of the individual predicted probabilities. ERSPC, European Randomized Study of Screening for Prostate Cancer; PCPT, Prostate Cancer Prevention Trial; ROC, receiver operating characteristic.