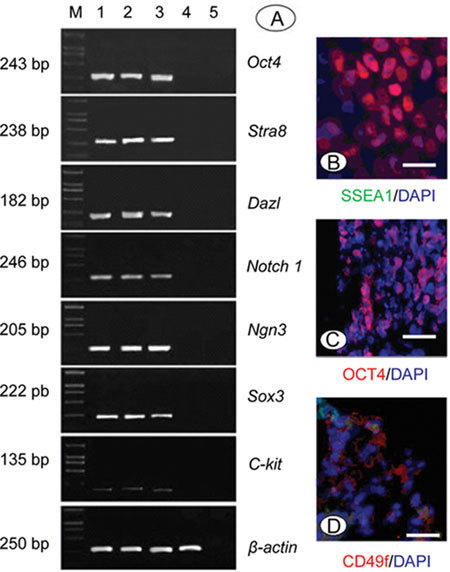
Figure 4.

Phenotypic characterization of human SSCs. (A): RT-PCR analysis of several spermatogonial stem cell (SSC) genes before culture (lane 1), after culture for 2 weeks (lane 2) and 1 month (lane 3), and on hdF (lane 4). Negative control (lane 5). Marker (lane M). (B)–(D): Immunocytological analysis of human SSC colonies grown on hdF for surface markers SSEA-1 (B), CD49f (D) and the nuclear marker OCT4 (C). Bars = 500 m.
