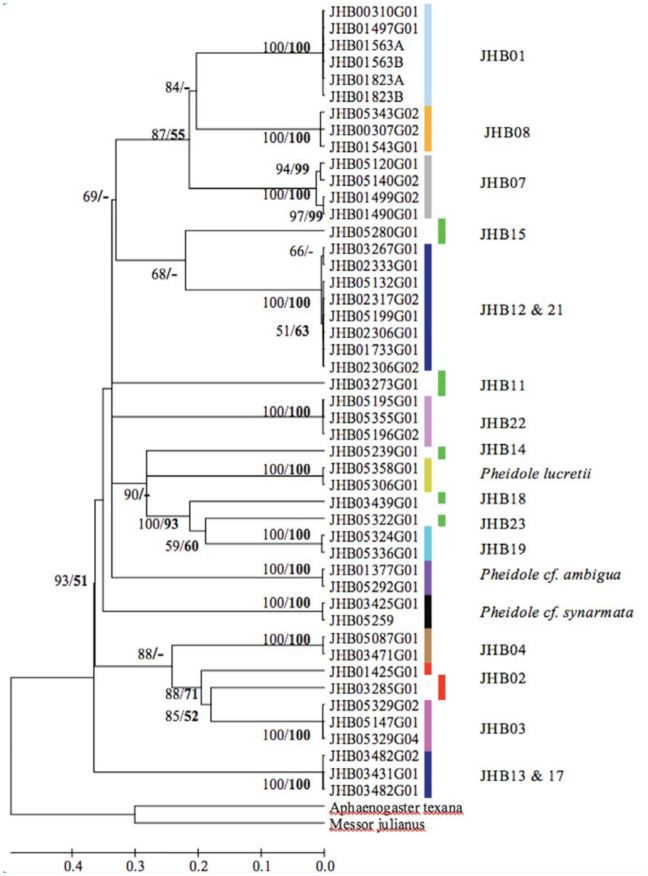
Figure 3.
Linearized Bayesian tree of the ant genus Pheidole from Rio Cachoeira Nature Reserve in the Brazilian Atlantic Forest, which defines 19 MOTUs. The clustering of individual sequences in the tree indicates the membership of each MOTU. MOTUs were inferred from a tree dependent clustering process, coupled with thresholds of 2%. Each colored bar represent a MOTU. The five green bars represent cases where only one individual was sequenced, two red bars indicate possible cryptic taxa, and the other two dark blue bars indicate MOTUs with shared taxa. The three names in front of the bars represent Pheidole species whose names were assigned based on morphological taxonomy, and the numbers preceded by JHB represent the different morphospecies. Posterior probability values for Bayesian tree and bootstrap support values for Neighbor-joining tree (in bold) above 50% are indicated on the nodes. A dash (-) indicates bootstrap values below 50%. High quality figures are available online.

