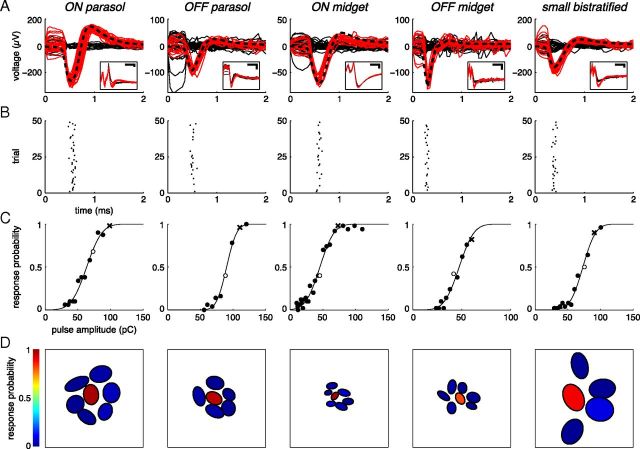
Figure 2.
Cells from each of the five major primate RGC types exhibited single-spike, submillisecond responses to electrical stimulation and could be activated without activating neighboring cells of the same type. A, Overlaid raw (inset) and artifact-subtracted voltage traces (main axes) recorded during and immediately after 50 stimulation trials, with successes (traces containing a spike) in red and failures (traces containing only stimulus artifact) in solid black. Black dashed traces show the spike template of each cell, taken from the electrical image (see Materials and Methods). Voltage traces were recorded by the electrode used for stimulation in all examples except the OFF parasol, in which voltage traces were recorded by a neighboring electrode. Scale bars: Insets, 0.5 ms and 100 μV. B, Raster plots of responses shown in A, with spike time defined as the negative peak of the spike waveform. C, Response probabilities measured over a range of pulse amplitudes, fit by a sigmoidal function (see Materials and Methods). For each cell, open circle indicates pulse amplitude applied in A and B, and “x ” indicates amplitude applied in D. D, Selective activation of the example cell among neighboring cells of the same type. Each cell is represented by an elliptical fit to its receptive field, and the color of the fit indicates the fraction of trials in which the current pulse elicited a response.

