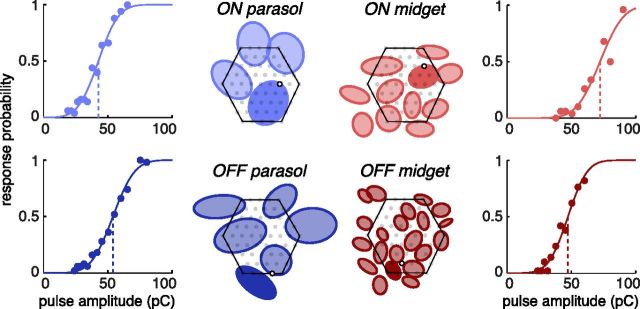
Figure 4.
ON and OFF parasol and midget cells in a single preparation exhibited similar activation thresholds. Response curve of one representative cell of each type is shown. Receptive fields of cells positioned over the array are depicted as elliptical fits (Fig. 1). Receptive fields of different cell types are plotted separately for clarity, with the array boundary indicated by the hexagonal outlines. The receptive field of the cell for which the response curve is given is indicated with a solid fill. The position of each corresponding stimulation electrode is depicted as an open black circle and the positions of the remaining electrodes are indicated with filled gray circles.

