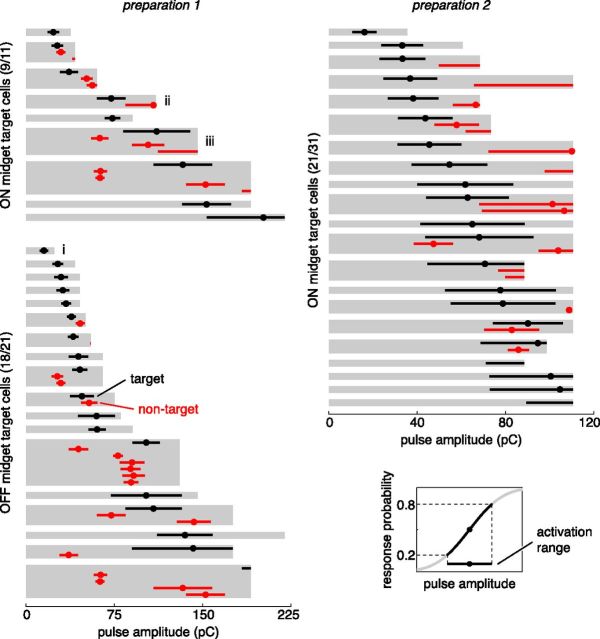
Figure 7.
Approximately half of the midget cells in two preparations could be activated without also activating any other midget or parasol cells in the region. Each gray region indicates the analyzed range of pulse amplitudes for the stimulation electrode chosen to activate a particular target cell. Circles and horizontal bars show the threshold and activation range of each activated cell, with target cells in black and non-target cells in red. The activation range was defined as the range of charge amplitudes that resulted in response probabilities between 0.2 and 0.8 (lower right inset). Selectivity attempts marked with i, ii, and iii correspond to examples in Figure 6A/B, C/D, and E/F, respectively.

