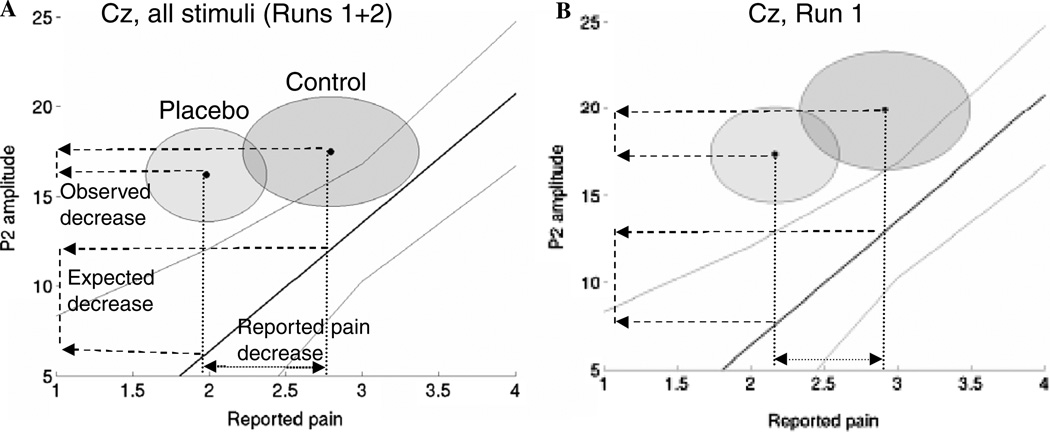
Fig. 5.
Test of the intensity reduction hypothesis of placebo. The solid line is the regression slope for the relationship between reported pain and P2 amplitude in the preliminary experiment (n = 10). Light gray lines show 90% confidence intervals, corresponding to the one-sided hypothesis of expected decreases in P2 with decreasing pain. The circles show 90% confidence regions in the control and placebo conditions (n = 24). Dashed lines on the y-axis show the observed placebo decrease and the expected decrease if the same reported pain decrease were produced by an intensity reduction. Confidence regions shown are between subjects, though tests of control–placebo and expected decreases were calculated within subjects. The observed decrease is significantly smaller than the expected decrease across both runs (A), but is not significantly different in the first run alone (B).

