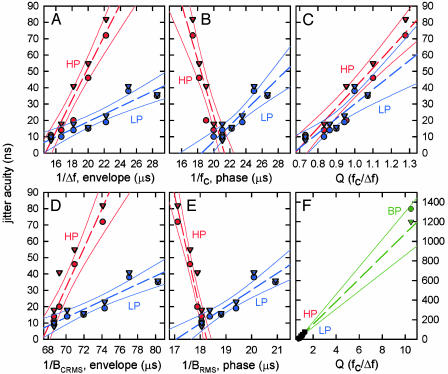
Fig. 2.
Jitter thresholds from Fig. 1E (bat 3, triangles; bat 5, circles) for different filter conditions (HP, red; LP, blue; BP, green). Data points shown with dashed regression lines and solid-line 99% confidence intervals. Measured thresholds are plotted against the reciprocal of echo bandwidth from filter settings (1/Δf) (A), the reciprocal of center frequency from filter settings (1/fc) (B), echo Q from filter settings (fc/Δf) (C), the reciprocal of CRMS bandwidth (BCRMS) (D), the reciprocal of RMS bandwidth (BRMS) (E), and echo Q as in C but with different scales to show BP condition (BP, green) (F). The value of Q is the reciprocal of normalized bandwidth for the target as a filter, and thus is normalized time-width for the target impulse response.

