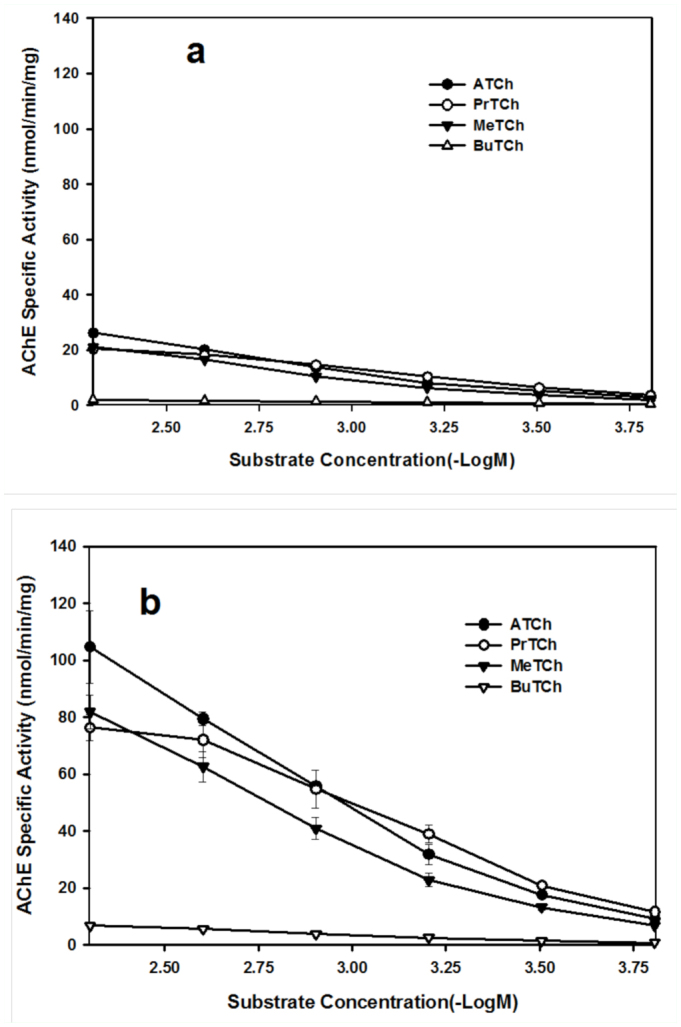
Figure 3.

Effect of substrate concentration on purified AChE activity from Rhopalosiphum padi (a) and Sitobion avenae (b). Substrates are ATCh, PrTCh, MeTCh and BuTCh. Each point represents the mean of three replicate assays. Vertical bars indicate error of the mean. High quality figures are available online.
