Abstract
We present a microfluidic biochip for trapping single white blood cells (WBCs). The novel biochip, microfabricated using standard surface micromachining processes, consists of an array of precisely engineered microholes that confine single cells in a tight, three dimensional space and mechanically immobilize them. A high (> 87%) trapping efficiency was achieved when WBC-containing samples were delivered to the biochip at the optimal pressure of 3 psi. The biochip can efficiently trap up to 7,500 cells, maintaining a high trapping efficiency even when the number of cells is extremely low (~200 cells). We believe that the developed biochip can be used as a standalone unit in a biology/clinical lab for trapping WBCs as well as other cell types and imaging them using a standard fluorescent microscope at the single cell level. Furthermore, it can be integrated with other miniaturized optical modules to construct a portable platform for counting a wide variety of cells and therefore it can be an excellent tool for monitoring human diseases at the point-of-care.
Keywords: Microfluidic biochip, microfabrication, white blood cell capture, trapping efficiency, fluorescence
1.1 Introduction
White blood cells (WBCs) and their subtypes are important constituents of the human immune system [1]. Their concentration, quantified by a WBC count test, indicates the state of body’s defense against potentially harmful pathogens such as bacteria, viruses, and fungi [2]. In addition, an abnormal WBC count (which corresponds to a concentration of > 10,000 WBCs/μl or < 4,000 WBCs/μl of whole blood), may be associated with certain hematologic malignancies [3, 4], autoimmune disorders [5, 6] or even drug toxicities [7–9]. WBC count tests are therefore important diagnostic tools for a number of human diseases and disorders, as well as for monitoring the progression and treatment of such pathological conditions.
WBC count tests are typically performed in ‘continuous-flow’ instrumentation, known as flow cytometers (FC) [10]. Although FCs have high throughput capacity and accuracy, they are expensive (tens of thousands of dollars), non-portable, consume large volumes (typically in the milliliter range) of blood samples and reagents and require considerable technical expertise for their operation and maintenance. Cell-capturing based microfluidic technology [11], has recently emerged as an alternative approach for replacing bulky and expensive continuous-flow’ instrumentation.
In cell-capturing microdevices, cells are mechanically or chemically immobilized on-chip and imaged/counted using a microscope and a CCD camera. Mechanical immobilization approaches typically employ a commercial membrane filter with micron-sized holes for capturing WBCs from whole blood [12]. The membrane filter also functions as cell separator: WBCs, being larger in size than the red blood cells (RBCs), are captured in the holes while the RBCs squeeze through the holes. However, the holes do not have a consistent shape and size, as a result some holes are fused together leading to the escape of WBCs. Microfabricated silicon-based microfilters have also been proposed for isolating WBCs from human whole blood [13]. These microfilter based devices essentially have a 2D architecture and they capture WBCs through their confinement in a single plane. In this case, the cells have the freedom to deform in the third dimension (out of plane) and this elastic deformation enables them to squeeze out of the microholes resulting in a lower (72–85%) trapping efficiency.
Chemical immobilization through immunoaffinity-based selection has also been used for capturing WBCs and their subtypes (e.g. CD4+ T-cells). The working principle is straightforward: blood samples flow through a microfluidic device which has been previously functionalized with antibodies against the desired cell surface receptors. In this approach, enumeration of the captured cells is done optically using a microscope [14–16] or electrically by measuring the impedance change upon cell lysis using on-chip electrodes [17]. Functionalization of those microdevices requires a number of incubation and washing steps while non-specific antibody binding reduces the purity of the functionalized cell population.
In this work, we describe a cell-capturing microfluidic biochip that mechanically traps single WBCs. The microdevice incorporates a novel 3D architecture in which an array of microholes (termed ‘microhole array’) is microfabricated on a suspended, thin film that is sandwiched between two microfluidic networks. The proposed device differs from previous membrane-type cell-capturing approaches as it confines WBCs in all 3 dimensions (a simple membrane confines cells only in 2 dimensions) leading to a high WBC trapping efficiency (> 87%). Similar to other cell-capturing devices, the 3D architecture also provides an advantage over flow cytometry approaches as thousands of on-chip trapped WBCs can be imaged/counted simultaneously using standard fluorescent microscopy. This precludes the need for precise alignment of optical elements with the microfluidic chip. Table 1 summarizes the advantages of the proposed approach over competing ones.
Table 1.
Comparison of this work with competing approaches.
| Trapping Method | Type of Cells That Can Be Trapped | Trapping Efficiency | Processing Time* | Chip Pretreatment Required | Chip Shelf Life |
|---|---|---|---|---|---|
| Mechanical 2D [13] | WBCs | 72–85% | 30 min – 1 hour | NO | Long (years) |
| Mechanical 3D (this work) | WBCs | > 87% | 30 min – 1 hour | NO | Long (years) |
| Non-mechanical (chemical immobilization) [14] | WBCs or a subset of them | > 90% | Few hours | YES | Limited (weeks) |
The processing time includes: chip pretreatment time, sample preparation time and sample run time.
Although we report results from lysed human blood samples, our microfluidic chip due to its unique two-layer architecture can potentially perform size-based separation of RBCs and platelets from WBCs. We envision the development of this microdevice into a generic platform for size-based capturing and imaging/counting of different types of cells for various point-of-care applications.
1.2 Material and Methods
1.2.1 Material
SU-8 photoresist was purchased from MicroChem (Newton, MA) and the polydimethylsiloxane (PDMS) elastomer was obtained from Dow Corning (Midland, MI). Chlorotrimethylsilane was purchased from Sigma Aldrich (St. Louis, MO). Phosphate buffered saline (PBS) was obtained from Mediatech, Inc (Manassas, VA). RBC lysis buffer was obtained from eBioscience (San Diego, CA). Alexa Fluor® 488-conjugated mouse antibody to human CD45 (AF488-anti-CD45) was purchased from Invitrogen (Frederick, MD).
1.2.2 Biochip Design
Our 3D cell-capturing chip (Fig. 1) consists of a membrane of ~10,700 microholes, ~3.5 μm in diameter that are patterned on a 1 μm thick silicon nitride film. The microholes are arranged in a 17 × 17 array of clusters (289 clusters in total). Each cluster contains 37 microholes and it is separated from its neighboring ones by a distance of ~120 μm. The entire microhole array is ~2 mm × 2 mm and it is sandwiched between two microfluidic networks. The top microfluidic network includes: (i) an inlet region that branches into 17 microfluidic channels (termed ‘inlet fluidic arms’) and (ii) 18 microfluidic channels (termed ‘outlet fluidic arms’ that merge into the outlet region. Each inlet fluidic arm is a 60 μm wide, 20 μm deep, dead-end microchannel that delivers WBCs to a single row of clusters (each row contains 17 clusters). The outlet fluidic arms are 26 μm wide, 20 μm thick, dead-end microchannels that are connected to the inlet fluidic arms through the bottom microfluidic network. The bottom microfluidic network consists of 30 μm long, 1.28 μm thick microchannels (termed ‘microfluidic connectors’) that connect the clusters from a single inlet fluidic arm to two outlet fluidic arms through a set of 4 μm in diameter microholes (termed ‘exit microholes’).
Figure 1.
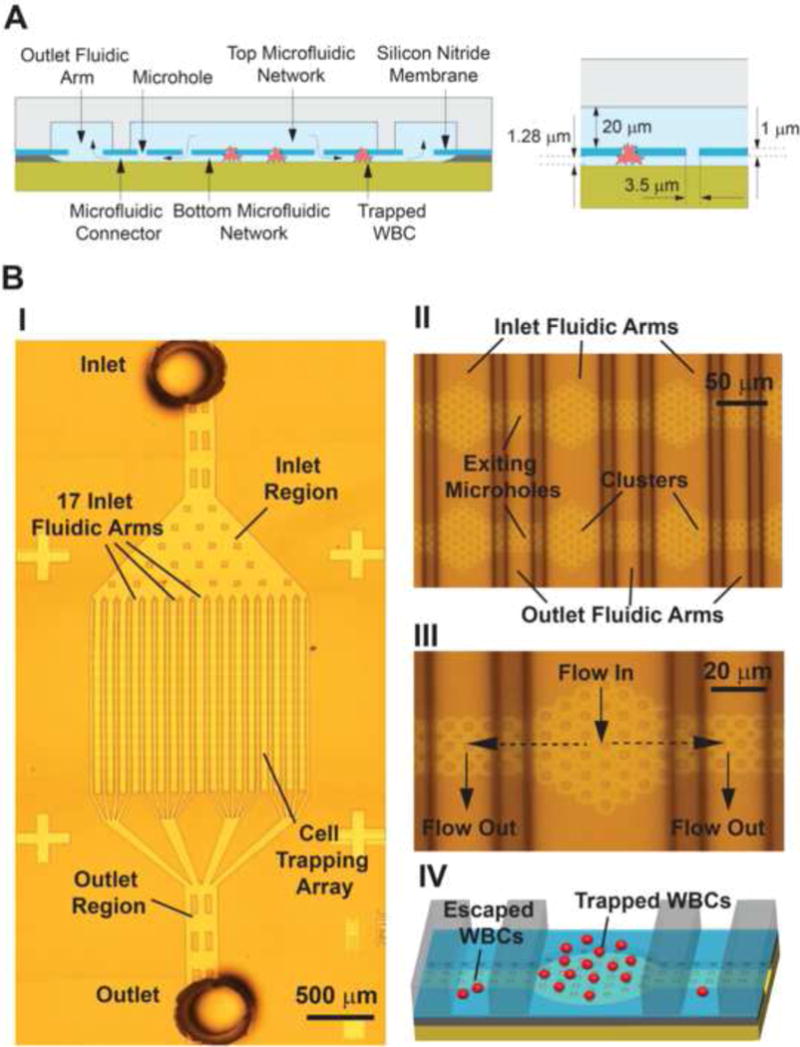
A) Cross section of the 3D architecture of the microfluidic biochip for trapping single WBCs. The microhole array is sandwiched between the top and bottom microfluidic networks. B) Snapshots of the microfabricated biochip (picture I was obtained by stitching 12 images together). Close-up views of the fluidic arms, clusters and microholes are shown in II and III. A 3D schematic of the biochip trapping region illustrates trapped and escaped WBCs in IV.
Connecting each inlet microchannel with two outlet microchannels enabled a uniform pressure drop in all cell trapping microholes in a cluster. In addition, this ‘interdigitated’ geometry resulted in a uniform flow distribution in all inlet microchannels and therefore eliminated preferential cell trapping. The use of clusters was chosen in order to facilitate the imaging/counting of the captured WBCs and avoid double cell counting as the geometry of a cluster can be easily identified as a reference point during image processing.
The working principle of the biochip is purely based on mechanical confinement (Fig. 2): WBCs, due to their large size (7–15 μm in diameter), are spatially restricted and therefore immobilized in the 3 dimensional space that is created by the microhole array and the thin (~1.28 μm thick) bottom microfluidic network. The diameter of the microhole (i.e. 3.5 μm) is chosen such that cells are initially trapped as they move from the top microfluidic channel to the bottom microfluidic channel. Subsequently the 1.28 μm thick layer prevents the WBCs from squeezing out of the microholes. Since the top microfluidic channel is thicker (20 μm) than the WBC diameter, the cells are not captured in the top microfluidic channel. While WBCs are being trapped in the microhole array, the remaining blood continues to flow through the microholes, the bottom microfluidic network and the outlet microchannel of the top microfluidic network. After the entire blood sample is processed, the number of trapped WBCs is counted by examining the microhole array under a fluorescent microscope.
Figure 2.
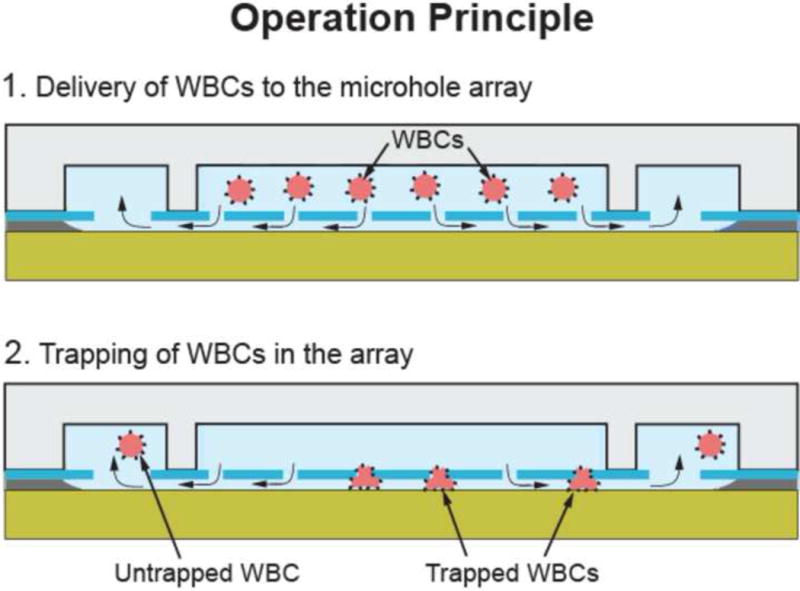
Trapping single WBCs in the biochip: WBCs are forced to squeeze in the 3D space formed between the microholes and the bottom microfluidic network. During this step, WBCs get trapped but few are able to escape.
1.2.3 Biochip Microfabrication
The biochip consists of two microfabricated modules: the ‘cell trapping’ module and the ‘sample delivery’ module (Fig. 3). The microfabrication of the trapping module starts with a low pressure chemical vapor deposition (LPCVD) of a silicon dioxide and a low stress silicon nitride layer (1.28 μm and 1 μm thick respectively) on a silicon substrate. The microhole array is then patterned on the silicon nitride layer using photolithography and reactive ion etching (RIE). An isotropic, HF time-etch step of the underlying silicon oxide layer is finally performed to obtain the microhole array and the bottom microfluidic network. The sample delivery module consists of a network of PDMS microfluidic channels fabricated using soft lithography. A 20 μm thick layer of SU-8 photoresist is spun and photolithographically patterned on a silicon wafer to obtain the microfluidic mold. PDMS is then cast on the SU-8 mold, cured at 65ºC for 4h and peeled off to obtain the sample delivery module. Silanization of the SU-8 mold prior to PDMS casting minimizes stiction of the cured PDMS. Holes are punched into the PDMS mold with a sharpened 10-gauge needle to obtain the inlet and outlet ports. Finally, the silicon nitride and the PDMS surfaces of the two modules are exposed to air plasma (120 mTorr, 30 W, 15 s) [18], aligned manually under a light microscope and bonded together.
Figure 3.
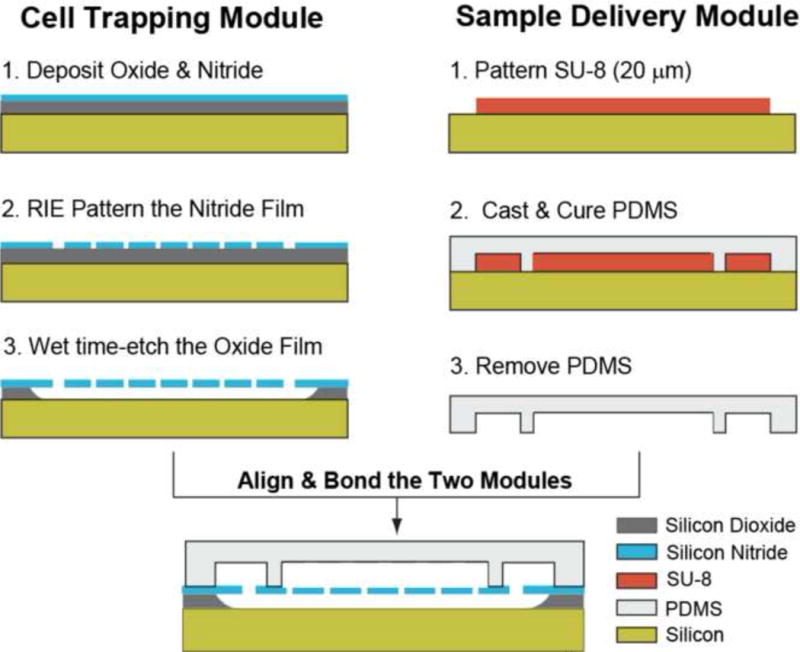
The microfabrication process of the biochip. The cell trapping and the sample delivery modules are microfabricated separately and subsequently exposed to air plasma, aligned and irreversibly bonded under an upright microscope.
1.2.4 Fluid Flow Simulations and Modeling
Parameters of the fluid flow through the biochip (pressure, volumetric flow rate and microfluidic resistance) were obtained using a combination of numerical (computational fluid dynamics (CFD)) and resistive electrical circuit simulations. Due to the low WBC concentration (~103 cells/μl) and the low Reynolds number (Re < 1) of our experiments, we assumed a single-phase flow model: we did not include cells in our simulations as the flow is expected not to be influenced by their presence. The microfluidic resistance and flow rate in a single cluster (Rcluster) was estimated in COMSOL using the laminar flow CFD module for different trapping scenarios. The fluidic resistance of a single microhole was calculated by dividing the pressure drop across it by the volumetric flow rate through it. Subsequently, the microfluidic resistance of an entire cluster was obtained by considering that all 37 microholes in the cluster are ohmic resistors connected in parallel (Rcluster = Fluidic resistance of a microhole/ 37).
All microchannels at the top and bottom microfluidic networks were represented as ohmic resistors with zero capacitance. In order to accurately represent the flow distribution in the 17 clusters, every inlet fluidic arm was divided into 17 sub-arms. A similar approach was used for modeling the outlet arms. The electrical circuit simulations were performed in LT Spice IV software assuming that: (a) there are no WBCs trapped in the microhole array and, b) each microfluidic segment (inlet and outlet fluidic sub-arms, microfluidic connectors) has a rectangular cross section. In this case, the fluidic resistance for each segment (Rinlet sub-arm, Rconnecor, Routlet sub-arm) in the circuit model was estimated by [19]:
where l, w and h are the length, width and thickness of each microfluidic segment respectively and η is the viscosity of the fluid (we used the viscosity of water (η = 10−3 Pa-s) in our calculations). We did not include the inlet and outlet regions in our model as those regions have a resistance that is orders of magnitude smaller than the microfluidic segments mentioned above.
The rectangular design of the inlet microchannel made it possible to have two outlet microchannels for each inlet microchannel which enabled a more uniform pressure drop across all cell trapping microholes in a cluster. This eliminated any preferential cell trapping bias experienced by some microholes in the cluster over the other microholes.
1.2.5 Blood Sample Preparation and Biochip Operation
All experiments were performed with lysed human blood samples. 20 μl of finger-prick human whole blood samples were initially mixed with a solution of monoclonal CD45 fluorescent antibodies (Alexa Fluor® 488-anti-CD45, Invitrogen Inc.) at a ratio of 10:3 (blood/solution) in order to label all WBCs. Subsequently, the red blood cells (RBCs) were removed by incubating the blood sample with a lysis buffer (eBioscience, San Diego, CA) for 10–15 min. The WBCs were then collected via centrifugation and diluted in PBS buffer (1x Dulbecco’s Phosphate Buffered Saline) to a total volume of 20 μl. 1 μl aliquots from this WBC-containing buffer solution were used for all experiments described below.
At the beginning of every experiment and before loading the blood sample, a purging step with PBS buffer was performed to remove air bubbles from the biochip and to ensure uniform flow conditions. All experiments were performed under constant pressure in order to eliminate WBC escape and/or rupture due to pressure buildup during the WBC trapping process. That was achieved by connecting the inlet of the biochip to a compressed air supply through a digital pressure controller (model number PC-30PSIG-D/5P, Alicat Scientific, Inc.). The outlet of the biochip was exposed to the atmospheric pressure.
1.2.6 WBC Counting
Fluorescently tagged WBCs were counted in the inlet region, the cell trapping array and the outlet region of the biochip using an upright epi-fluorescent microscope (Olympus BX51WI) that was equipped with a 20x objective (Olympus, LMPlanFL N, numerical aperture = 0.4) and a low-light CCD camera (QuantEM: 512SC, Photometrics Inc.). The WBC number in the inlet region and the cell trapping array was obtained by analyzing images from those regions at the end of each experiment (e.g. when 1 μl of lysed blood sample was processed through the biochip). The fluorescent images were analyzed using commercial imaging software (MetaMorph, Molecular Devices Inc.). Fluorescent impurities (e.g. residuals formed during lysing, dust particles, etc) that could alter the WBC count were eliminated by comparing their size and fluorescence intensity with the average size and fluorescent intensity of manually-identified WBCs. WBCs that exited the cell trapping array were manually counted on the fly by continuously monitoring the flow through the outlet region of the biochip.
1.3 Results
1.3.1 Pressure and Flow Rate Distribution in the Biochip
We performed CFD simulations to obtain the pressure profile in a single cluster for different trapping scenarios (Fig. 4). Each trapping scenario was represented by its ‘microhole occupancy’, which is the number of WBC-occupied microholes in the cluster over the total number of microholes in the cluster (37 in total). We focused our analysis on the maximum pressure difference (ΔPmax) across the microholes as this determines the tendency of an incoming cell to remain trapped or squeeze out and therefore affecting the trapping efficiency. In all simulations, a 3 psi pressure difference between the inlet and outlet of the simulated fluidic domain was used. We also assumed that there is no flow through a WBC-occupied microhole. Our results (Fig. 4C and 4D) suggest that: a) the pressure distribution among open (not occupied with WBCs) microholes is uniform for all trapping scenarios. Therefore, WBCs that enter the cluster region do not have a preference over what flow path to follow and, b) the ΔPmax across the open microholes remains relatively stable for up to ~70% microhole occupancy. However beyond 70% occupancy, ΔPmax rises considerably which can lead to cell escape and reduced trapping efficiency. Considering the 70% occupancy limit and the fact that our biochip has a total of 10,700 microholes, it is expected that the biochip can efficiently trap up to ~7,500 WBCs (70% occupancy) before there is a significant pressure drop across the remaining open microholes. That number of WBCs is compatible with finger-prick point-of-care devices that typically process ~0.5 μl of whole blood [20] (0.5 μl of blood contains an average of 3,000–5,000 WBCs in healthy individuals).
Figure 4.
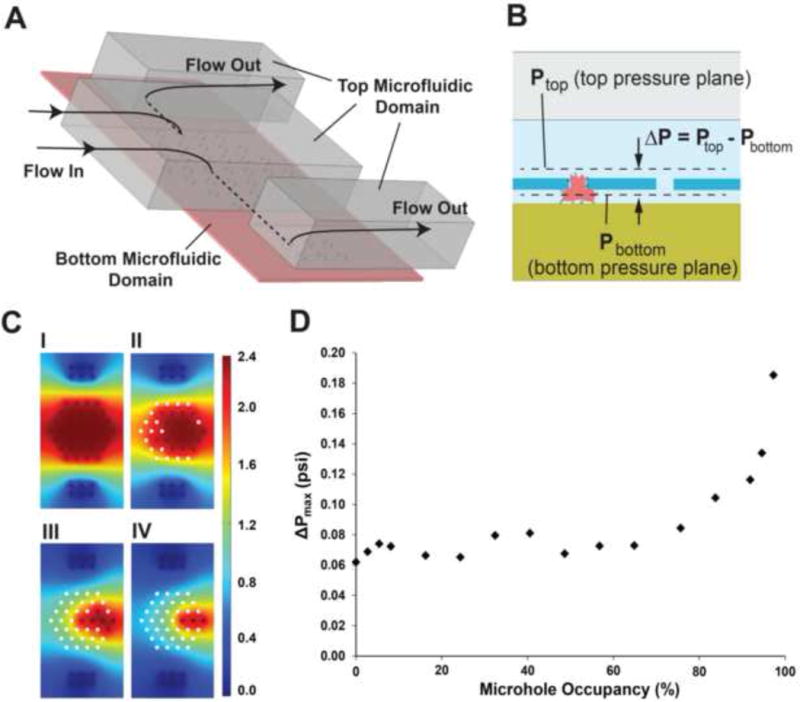
(A) The 3D CFD model used to simulate the flow through a single cluster. The dotted lines indicate flow through the bottom microfluidic domain. (B) Two pressure planes, located right at the entrance and exit of the microhole array, were used to calculate the pressure drop (ΔP) distribution across the array. (C) The pressure distribution at the bottom pressure plane (Pbottom, as indicated in B) for 0% (I), ~49% (II), ~84% (III) and ~92% (IV) microhole occupancy. White circles indicate trapped WBCs and therefore there is no pressure value associated with them. Pbottom values are in psi. (D) Maximum pressure drop (ΔPmax) versus microhole occupancy in a cluster. ΔPmaxwas calculated only in unoccupied microholes.
Furthermore, using the dual modeling approach described above and assuming pressure-driven flow, we obtained the flow rate through each of the 17 clusters contained in a single inlet fluidic arm (Fig. 5). We observed that the maximum and minimum relative (volumetric) flow rates (the relative flow rate is the ratio of the flow rate through a cluster divided by the total flow rate entering the inlet fluidic arm) were 6.3% and 5.7% respectively, indicating that the flow is divided almost equally among all clusters in a single inlet fluidic arm. This small variation can be attributed to the high microfluidic resistance of each of the microfluidic connectors (Rconnector ~ 9.1 ×10¹⁵ Pa-s/m3) which exceeds the resistance of the inlet fluidic sub-arm (Rinlet sub-arm ~ 1013 Pa-s/m3) and of a cluster (Rcluster ~ 3.5 × 10¹³ Pa-s/m3) by three and two orders of magnitude respectively. Maintaining a uniform flow distribution among all clusters in an inlet fluidic arm ensures an equal probability of trapping WBCs in the array. We should also mention that all inlet and outlet fluidic arms are connected in parallel to the inlet and outlet regions respectively, and therefore they experience identical flow conditions.
Figure 5.
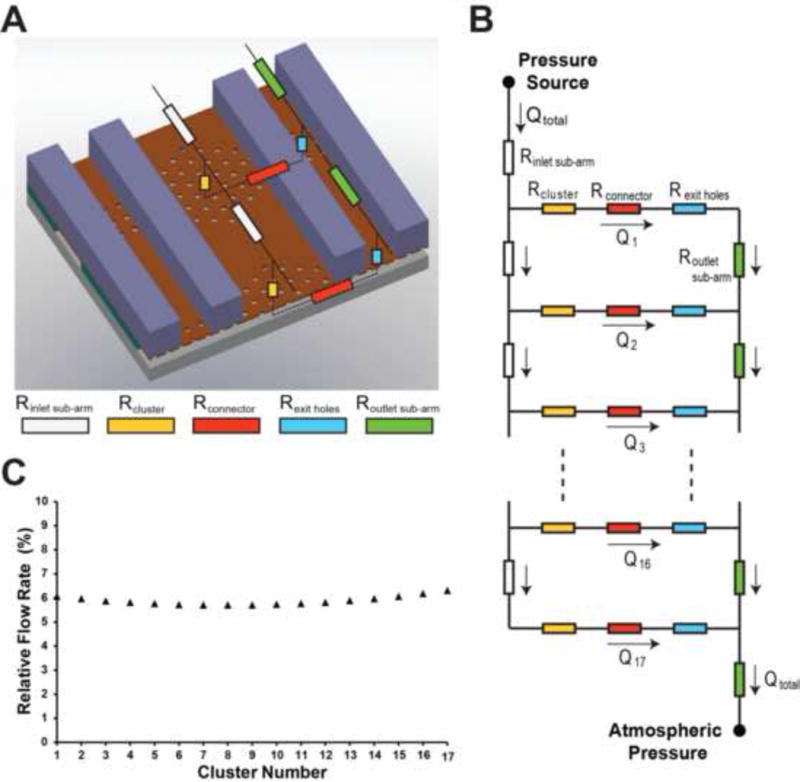
(A) Partial schematic of the electrical model of the trapping region. As the flow in each of the two outlet arms that connect each inlet fluidic arm is identical, we used a single outlet arm in our model. In this case, the fluidic resistance of the arms and the exit holes was doubled in the simulations. (B) Electrical model of the entire fluidic arm. Each arm was divided into 17 inlet sub-arms that distribute the total flow rate (Qtotal) into the individual clusters. 17 such inlet fluidic arms, connected in parallel, represent the electrical model of the entire biochip (not shown). (C) Relative flow rate in each cluster (assuming no WBCs are trapped in the cluster).
1.3.2 Maximum WBC Trapping Efficiency
In order to obtain the optimum pressure that resulted in the highest trapping efficiency (Etrap), we conducted experiments at a pressure range of 1–7 psi with 1 μl blood samples containing at least 200–500 WBCs (Fig. 6). We defined Etrap at a given pressure as the percentage ratio of WBCs captured in the cell trapping array over the total number of WBCs processed through the biochip:
Figure 6.
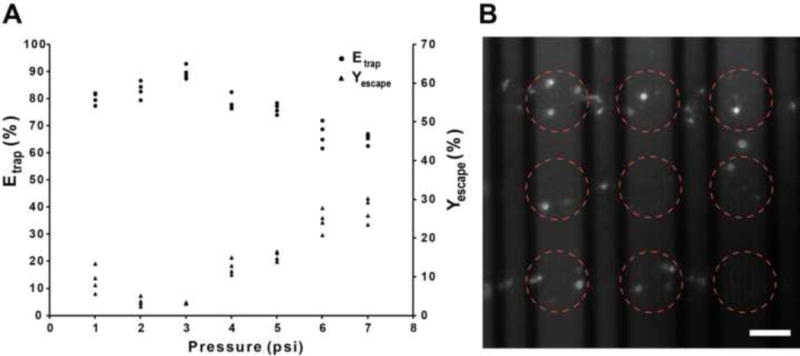
(A) WBC trapping efficiency (Etrap) and WBC escape yield (Yescape) versus applied pressure. Each data point is the result from a single experiment using a new biochip every time. The number of WBCs processed in those experiments varied between 200 and 500 WBCs. (B) Fluorescent image of trapped WBCs. Some fluorescent residue is also visible. The red circles indicate the location of clusters. Scale bar, 50 μm.
The total number of WBCs was calculated by adding the number of WBCs that remained in the inlet region (Nin), the ones that trapped in the array (Narray) and the ones that escaped in the outlet region of the biochip (Nout). We also calculated the WBC escape yield (Yescape) which is the percentage ratio of Nout over the sum of Narray and Nout . The Yescape does not consider the Nin and hence it is a more realistic indicator of the ability of the microhole array to capture WBCs.
Our results indicate that the Etrap reaches a maximum value of ~90% (average from 4 measurements) at 3 psi. At lower pressures, Etrap decreases by approximately 10%. This decrease can be attributed to the higher number of WBCs remained in the inlet region due to the low flow rate/WBC velocity. Beyond 3 psi, Etrap decreases linearly with pressure as a larger number of WBCs squeeze through the microholes and escape the biochip. It was also observed that a slightly higher percentage of WBCs escape the array at 1–2 psi when compared to the optimum pressure of 3 psi (Fig. 6, % WBC escape curve). This counterintuitive observation can be attributed to the longer time that is required for the 1 μl of blood sample to flow through the biochip at low pressures. A prolonged processing time causes initially trapped WBCs to squeeze out of the array and finally exit the biochip. Beyond 3 psi, as anticipated, the Yescape increases with pressure, reaching a value of 24–30% at 7 psi.
For pressures 7 psi and above, the high flow rate resulted in an inaccurate count of the number of WBCs exiting the biochip using the imaging modality described earlier. At pressures 1 psi and below, the flow was extremely slow, leading to the sticking of incoming WBCs to the PDMS surface and causing an aggregation of WBCs in the inlet region. However since the top microfluidic network is 20 μm thick, the WBCs (7–15 μm) did not block the flow in the inlet region. At pressures 5 psi and above, a small percentage (< 5%) of the WBCs squeezed out of the microholes and were trapped in the bottom microfluidic layer (1.28 μm thickness). These cells were considered ‘escaped’ cells and hence they were counted as lost’ cells. In addition, for each of the pressure conditions (1–7 psi), we continuously visualized the cell trapping process to determine if WBCs are disintegrated in the microhole array. We did not observe such events.
1.3.3 WBC trapping efficiency versus number of processed WBCs
We furthermore measured the trapping efficiency for different WBC concentrations (100–1000 WBCs/μl) at the optimum pressure of 3 psi (Fig. 7A). We chose ~100 WBCs per μl to be the lower limit as this represents the extremely low number of WBCs present in patients with a weak immune system (e.g. end-stage AIDS patients). To achieve low WBC concentration values, blood samples were diluted by 5–6 fold after the lysis step. In the above range of input WBC concentrations, Etrap exhibited small variations, ranging between 87–95%. The WBC escape percentage (Fig. 7B) varied between 1.8 – 3.6%, indicating that a very low number of processed WBCs were able to squeeze out of the array.
Figure 7.
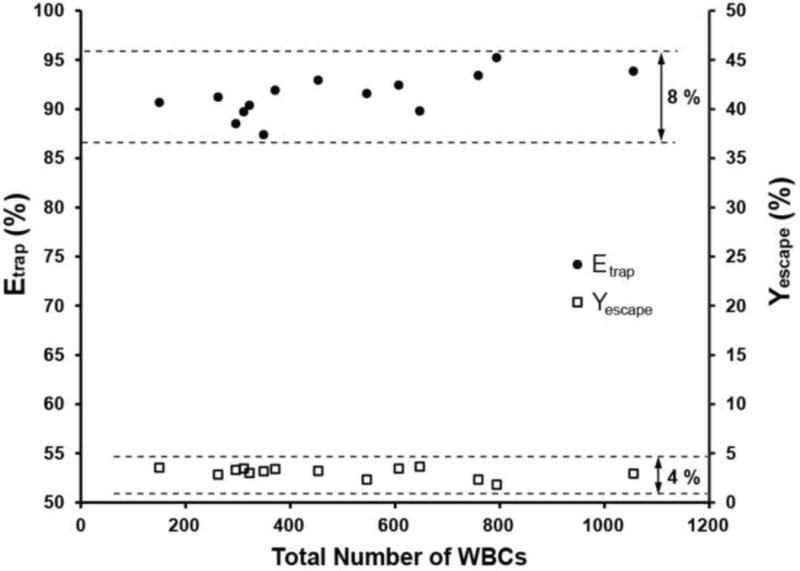
WBC trapping efficiency (Etrap) and escape yield (Yescape) versus the total number of WBCs processed through the biochip at the optimum pressure of 3 psi. Each data point was obtained from a single experiment using a new biochip every time. In the WBC range tested, Etrap and Yescape varied by ~8% and ~4% (maximum-minimum) respectively.
1.4 Discussion
We presented a novel 3D microfluidic architecture for capturing WBCs. Although the maximum trapping efficiency (~90%) of our biochip is higher than other size-based cell trapping approach by 5–15% [13], the ultimate limit of trapping all WBCs was not achieved for two reasons: (i) a small number of WBCs – probably the ones with the smallest diameter (e.g. lymphocytes)-were able to escape the array and (ii) some WBCs adhered at the inlet of the biochip. The latter reason had a dominant effect on reducing the trapping efficiency as the number of WBCs adhered at the inlet region was 2–3 times higher than the number of WBCs that escaped the array. We anticipate that the functionalization of the microfluidic walls with a blocker against non-specific protein binding (e.g. bovine serum albumin (BSA) solution, Pluronic surfactants) [21, 22] would minimize cell adherence and therefore increase the trapping efficiency. We did not perform this functionalization step as we were interested in evaluating the purely geometry-based trapping efficiency and demonstrating efficient trapping without the need of pretreating the biochip. Moreover, reducing the microhole diameter could further increase the trapping efficiency as the smallest WBCs will not be able to escape. We choose a diameter of 3.5 μm as this size could be robustly and repeatedly engineered without pushing the limits of photolithography (e.g. using high resolution masks). An alternative strategy for capturing the smallest WBCs would have been to decrease the thickness of the bottom microfluidic network. Such an approach is not recommended as it can dramatically increase the fluidic resistance and therefore the time needed to process the blood sample.
Our simulation results indicate that the Etrap of the proposed design is not affected by the total number of WBCs trapped as long as that number does not exceed ~7,500 WBCs (70% occupancy of the array). That number is larger than the number of WBCs expected in most patients with compromised immune system (3,500–5000 WBCs/μl). In any case, the size of the microhole array can be easily scaled up if a large number of WBC needs to be processed.
An important aspect of the silicon-based biochip is the possibility to reuse it as well as its expected microfabrication cost. It is possible to wash the biochip with a cell lysing hypotonic solution which will lyse the captured WBCs as well as WBCs stuck to the PDMS surface in the inlet. The WBCs can thus be removed from the biochip and the biochip can be used a couple of times before it gets clogged with cellular residues. Although that is an option, it is not a recommended one for point-of-care applications, since the washing step cannot be performed easily from the end user (e.g. patient). In this case, the manufacturing cost can become an issue. Using our academic cleanroom facilities, we estimated the manufacturing cost to be less than $10/biochip. However, that cost can be significantly reduced if the biochip is mass produced.
An additional feature of our biochip is the ability to collect the trapped WBCs by reversing the flow under pressure (i.e. from outlet to inlet). As a result, the WBCs can be pushed out of the array and collected in the inlet. However, the collected WBCs might also include cells trapped in the inlet.
Finally, we should emphasize that all our experiments were performed with lysed human whole blood samples. The removal of RBCs from whole blood was necessitated due to their overwhelming number (~6 million RBCs in 1 μl) over the number of WBCs. Experiments were also performed with whole blood samples, but they were not successful: RBCs tend to stick to the microhole array, clogging the biochip. The clogging was not that severe when highly diluted whole blood samples (1:100 blood/buffer) were used; however the time required for processing the large volume of the diluted sample increased considerably (15–20 min at 3 psi). This resulted in a decrease in the trapping efficiency as many trapped WBCs eventually squeezed out of the microhole array. Future biochip designs can incorporate an on-chip RBC lysis chamber [23] and/or a metering chamber [24, 25] upstream of the microhole array. Such an integration scheme would eliminate the various off-chip lysis/dilution steps and potentially improve WBC viability as well as the overall performance of the biochip.
1.5 Conclusions
Monitoring of diseases that compromise the immune system (e.g. AIDS, aplastic anemia) is performed by counting WBCs and/or their subtypes. Here, we presented a novel microfluidic biochip for trapping and counting WBCs in minute volumes of lysed, diluted blood samples. The biochip incorporates an array of ~10,700 microholes that is sandwiched between two microfluidic networks. This unique architecture enables the three-dimensional confinement/trapping of WBCs in the array, resulting in a high trapping efficiency (> 87%). Despite the fact that the cell count was manually performed under a fluorescent microscope, we envision interfacing our biochip with a compact portable optical system [26] that will report the cell count automatically. Finally, the developed technology can be used to trap other types of cells (e.g. circulating tumor cells) or microorganisms (e.g. bacteria) as its geometry of the microhole array can be easily modified.
Highlights.
We have developed a microfluidic biochip for trapping single white blood cells
The biochip is microfabricated using surface micromachining processes
Biochip consists of a microhole array that confine and immobilize cells in 3D space
A high (> 87%) capture efficiency of white blood cells obtained using the biochip
The biochip can be used in biology/clinical labs for capturing various cell types
Acknowledgments
This work was supported by the National Institute of Health (NIH), under the 2009 Director’s New Innovator Award (DP2OD006456). All the devices were fabricated at the Lurie Nanofabrication Facility at the University of Michigan and at the Georgia Institute of Technology Nanotechnology Research Center. We also thank Spencer Marsh, Trushal Chokshi, Mostafa Ghannad-Rezaie and Mayurachat Gulari for useful discussions.
Biographies
ANURAG TRIPATHI received his B.Tech and Ph.D. degrees from Indian Institute of Technology Kanpur and University of Michigan Ann Arbor in 2004 and 2012 respectively, both in Mechanical Engineering. In 2007, he joined the BioMEMS laboratory at University of Michigan as a graduate student researcher under the supervision of Nikos Chronis. In October 2012, he joined Intel Corporation as a senior process engineer. He has authored peer-reviewed conference and journal papers on high optical performance microlens arrays. His research interests include optical MEMS, microfluidics and lab-on-chip biomedical devices.
JAMES RIDDELL IV received his medical school training at Case Western Reserve University in Cleveland, Ohio and then performed an Internal Medicine Residency followed by a fellowship in Infectious Diseases at the University of Michigan in Ann Arbor, Michigan. He is a Clinical Associate Professor at the University of Michigan and specializes in the care of patients with HIV infection. Dr. Riddell is the Director of HIV clinical research at the University of Michigan and has authored over 30 publications and has been a principal investigator or co-investigator on over 30 industry and NIH funded research projects.
NIKOS CHRONIS received his B.S. and Ph.D. degrees from Aristotle University (Greece) and University of California at Berkeley in 1998 and 2004 respectively, both in Mechanical Engineering. In 2000, he joined the Berkeley Sensor and Actuator Center at UC Berkeley as a graduate student researcher under the supervision of Luke Lee. In 2004, he worked as a postdoc at Rockefeller University (New York). In August 2006, he joined the Mechanical Engineering department at the University of Michigan as an assistant professor. His research interests include polymer MEMS, microfluidics, optical MEMS for lab-on-chip applications, and in-vivo imaging of neural circuits in C. elegans.
Footnotes
Publisher's Disclaimer: This is a PDF file of an unedited manuscript that has been accepted for publication. As a service to our customers we are providing this early version of the manuscript. The manuscript will undergo copyediting, typesetting, and review of the resulting proof before it is published in its final citable form. Please note that during the production process errors may be discovered which could affect the content, and all legal disclaimers that apply to the journal pertain.
Contributor Information
Anurag Tripathi, Email: anuragt@Rumich.edu.
James Riddell, IV, Email: jriddell@med.umich.edu.
Nikos Chronis, Email: chronis@umich.edu.
References
- 1.Janeway CA. Immunobiology: the immune system in health and disease. 1996 [Google Scholar]
- 2.Eales LJ. Immunology for Life Scientists. John Wiley & Sons; 2003. Incorporated. [Google Scholar]
- 3.Brown DW, Giles WH, Croft JB. White blood cell count: An independent predictor of coronary heart disease mortality among a national cohort. Journal of clinical epidemiology. 2001;54:316. doi: 10.1016/s0895-4356(00)00296-1. [DOI] [PubMed] [Google Scholar]
- 4.Cheson BD, Bennett JM, Grever M, Kay N, Keating MJ, O’Brien S, et al. National Cancer Institute-sponsored Working Group guidelines for chronic lymphocytic leukemia: revised guidelines for diagnosis and treatment. Blood. 1996;87:4990. [PubMed] [Google Scholar]
- 5.Liu MF, Wang CR, Fung LL, Wu CR. Decreased CD4 CD25 T Cells in Peripheral Blood of Patients with Systemic Lupus Erythematosus. Scandinavian journal of immunology. 2004;59:198–202. doi: 10.1111/j.0300-9475.2004.01370.x. [DOI] [PubMed] [Google Scholar]
- 6.Ohshima S, Saeki Y, Mima T, Sasai M, Nishioka K, Ishida H, et al. Long-term follow-up of the changes in circulating cytokines, soluble cytokine receptors, and white blood cell subset counts in patients with rheumatoid arthritis (RA) after monoclonal anti-TNFα antibody therapy. Journal of clinical immunology. 1999;19:305–13. doi: 10.1023/a:1020543625282. [DOI] [PubMed] [Google Scholar]
- 7.Sunyer J, Munoz A, Peng Y, Margolick J, Chmiel JS, Oishi J, et al. Longitudinal relation between smoking and white blood cells. American journal of epidemiology. 1996;144:734. doi: 10.1093/oxfordjournals.aje.a008997. [DOI] [PubMed] [Google Scholar]
- 8.Nakanishi N, Suzuki K, Tatara K. Association between lifestyle and white blood cell count: a study of Japanese male office workers. Occupational medicine (Oxford) 2003;53:135–7. doi: 10.1093/occmed/kqg029. [DOI] [PubMed] [Google Scholar]
- 9.Nishitani N, Sakakibara H. Subjective poor sleep and white blood cell count in male Japanese workers. Industrial health. 2007;45:296. doi: 10.2486/indhealth.45.296. [DOI] [PubMed] [Google Scholar]
- 10.Pappas D, Wang K. Cellular separations: A review of new challenges in analytical chemistry. Analytica Chimica Acta. 2007;601:26–35. doi: 10.1016/j.aca.2007.08.033. [DOI] [PubMed] [Google Scholar]
- 11.Pratt ED, Huang C, Hawkins BG, Gleghorn JP, Kirby BJ. Rare cell capture in microfluidic devices. Chemical Engineering Science. 2011:1508–22. doi: 10.1016/j.ces.2010.09.012. [DOI] [PMC free article] [PubMed] [Google Scholar]
- 12.Rodriguez WR, Christodoulides N, Floriano PN, Graham S, Mohanty S, Dixon M, et al. A Microchip CD4 Counting Method for HIV Monitoring in Resource-Poor Settings. PLoS Med. 2005;2:663–72. doi: 10.1371/journal.pmed.0020182. [DOI] [PMC free article] [PubMed] [Google Scholar]
- 13.Ji HM, Samper V, Chen Y, Heng CK, Lim TM, Yobas L. Silicon-based microfilters for whole blood cell separation. Biomedical Microdevices. 2008;10:251–7. doi: 10.1007/s10544-007-9131-x. [DOI] [PubMed] [Google Scholar]
- 14.Cheng X, Irimia D, Dixon M, Sekine K, Demirci U, Zamir L, et al. A microfluidic device for practical label-free CD4 T cell counting of HIV-infected subjects. Lab on a Chip. 2007;7:170–8. doi: 10.1039/b612966h. [DOI] [PMC free article] [PubMed] [Google Scholar]
- 15.Cheng X, Gupta A, Chen C, Tompkins RG, Rodriguez WR, Toner M. Enhancing the performance of a point-of-care CD4 T-cell counting microchip through monocyte depletion for HIV/AIDS diagnostics. Lab on a Chip. 2009;9:1357–64. doi: 10.1039/b818813k. [DOI] [PMC free article] [PubMed] [Google Scholar]
- 16.Wang Z, Chin SY, Chin CD, Sarik J, Harper M, Justman J, et al. Microfluidic CD4 T-Cell Counting Device Using Chemiluminescence-Based Detection. Analytical Chemistry. 2010;82:36–40. doi: 10.1021/ac902144w. [DOI] [PubMed] [Google Scholar]
- 17.Cheng X, Liu Y, Irimia D, Yang L, Lee Z, Rodriguez WR, et al. Cell detection and counting through cell lysate impedance spectroscopy in microfluidic devices. Lab on a Chip. 2007;7:746–55. doi: 10.1039/b705082h. [DOI] [PMC free article] [PubMed] [Google Scholar]
- 18.Tang KC, Liao E, Ong WL, Wong JDS, Agarwal A, Nagarajan R, et al. Evaluation of bonding between oxygen plasma treated polydimethyl siloxane and passivated silicon. Journal of Physics: Conference Series. 2006;34:155–61. [Google Scholar]
- 19.Bruus H. Theoretical Microfluidics. Oxford University Press; 2008. [Google Scholar]
- 20.Hu J. The evolution of commercialized glucose sensors in China. Biosensors & bioelectronics. 2009;24:1083. doi: 10.1016/j.bios.2008.08.051. [DOI] [PubMed] [Google Scholar]
- 21.Shao G, Wang J, Li Z, Saraf L, Wang W, Lin Y. Poly (dimethylsiloxane) microchip-based immunoassay with multiple reaction zones: Toward on-chip multiplex detection platform, Sensors and actuators B. Chemical. 2011;159:44–50. [Google Scholar]
- 22.Falconnet D, Csucs G, Grandin HM, Textor M. Surface engineering approaches to micropattern surfaces for cell-based assays. Biomaterials. 2006;27:3044–63. doi: 10.1016/j.biomaterials.2005.12.024. [DOI] [PubMed] [Google Scholar]
- 23.Son SU, Seo JH, Choi YH, Lee SS. Fabrication of a disposable biochip for measuring percent hemoglobin A1c (%HbA1c) Sensors and Actuators A: Physical. 2006;130–131:267–72. [Google Scholar]
- 24.Steigert J, Brenner T, Grumann M, Riegger L, Lutz S, Zengerle R, et al. Integrated siphon-based metering and sedimentation of whole blood on a hydrophilic lab-on-a-disk. Biomedical microdevices. 2007;9:675–9. doi: 10.1007/s10544-007-9076-0. [DOI] [PubMed] [Google Scholar]
- 25.Dimov IK, Basabe-Desmonts L, Garcia-Cordero JL, Ross BM, Ricco AJ, Lee LP. Stand-alone self-powered integrated microfluidic blood analysis system (SIMBAS) Lab on a chip. 2011;11:845. doi: 10.1039/c0lc00403k. [DOI] [PubMed] [Google Scholar]
- 26.Coskun AF, Su T, Ozcan A. Wide field-of-view lens-free fluorescent imaging on a chip. Lab on a Chip. 2010;10:824–7. doi: 10.1039/b926561a. [DOI] [PMC free article] [PubMed] [Google Scholar]


