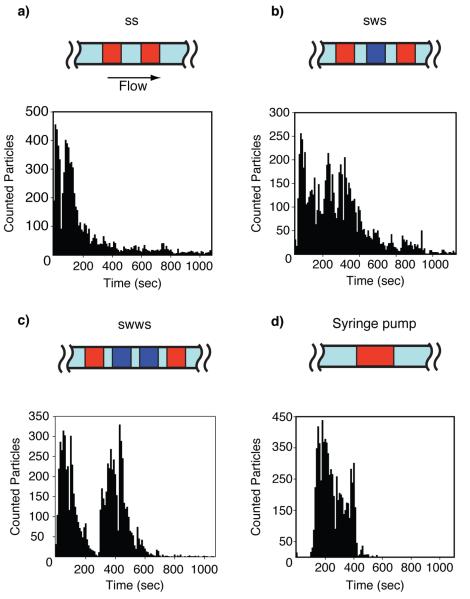
Fig. 3.
Pulse counts versus time for passive pumping devices using the droplet patterns (a) SS, (b) SWS, (c) SWWS. (d) A syringe pump was used for the control. Distinct peaks that exponentially decay can be seen in the passive pumping histograms, representing the bolus of particles from each sample droplet. The continuous flow of the syringe pump resulted in a well-defined bolus of particles. S = sample droplet. W = wash (saline) droplet.

