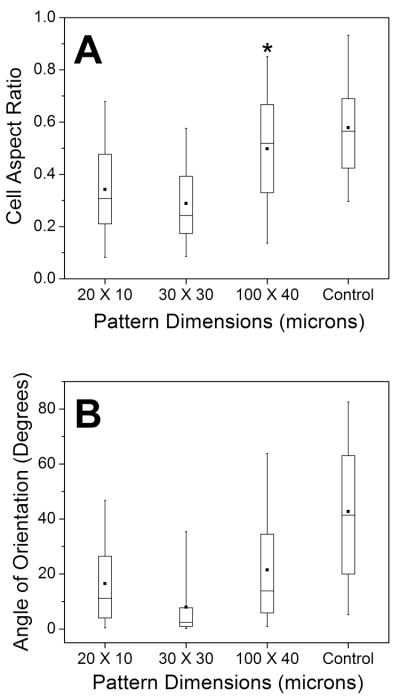
Fig. 4.
Box plots for cell aspect ratio (A) and angle of orientation (B). Plots represent the distribution of all measurements (n = 100). The boxes span the 25th to 75th percentiles, and the whiskers span the 5th to 95th percentiles of the distribution. The square in the box is the mean, and the horizontal line is the median. The asterisk (*) denotes no statistical difference compared to the control.

