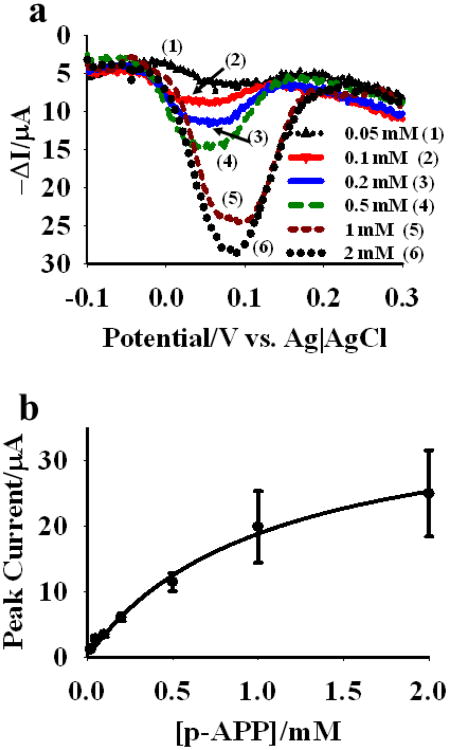
Fig. 3.
(a) Square wave voltammograms for different concentrations of p-APP incubated for 30 min with the anti-CEA antibody-ALP conjugate immobilized onto NPG. (b) Michaelis-Menten plot for immobilized anti-CEA antibody-ALP conjugate on NPG. Different concentrations of p-APP were incubated with three different wires for 30 min prior to square wave voltammetric measurement. Mean peak currents for three wires were measured and plotted against the p-APP concentrations. SWV measurements were done in 100 mM glycine buffer (pH 9.0).

