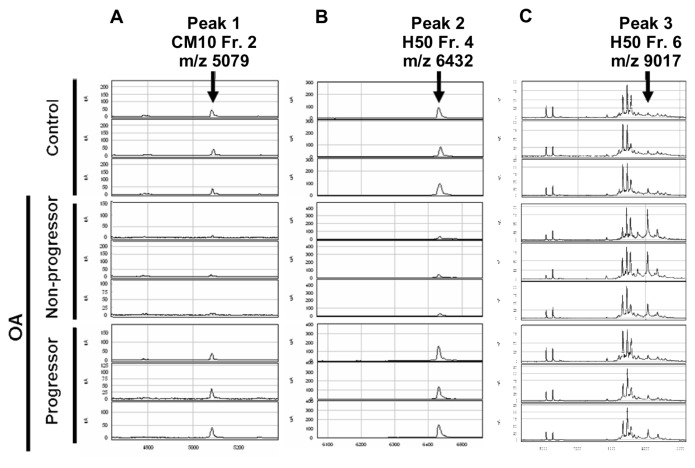
Figure 2.
Results of SELDI-TOF MS analysis. Representative results of plasma samples from healthy donors (Control), nonprogressors, and progressors are shown for each of fraction 2 (Fr. 2) with CM10 (A), fraction 4 (Fr. 4) with H50 (B), and fraction 6 (Fr. 6) with H50 (C). Arrows indicate the peaks with significantly different intensities between progressors and nonprogressors, which were designated as peak 1 (A), 2 (B), and 3 (C), respectively. The m/z values for these peaks are shown.

