
Figure 2.
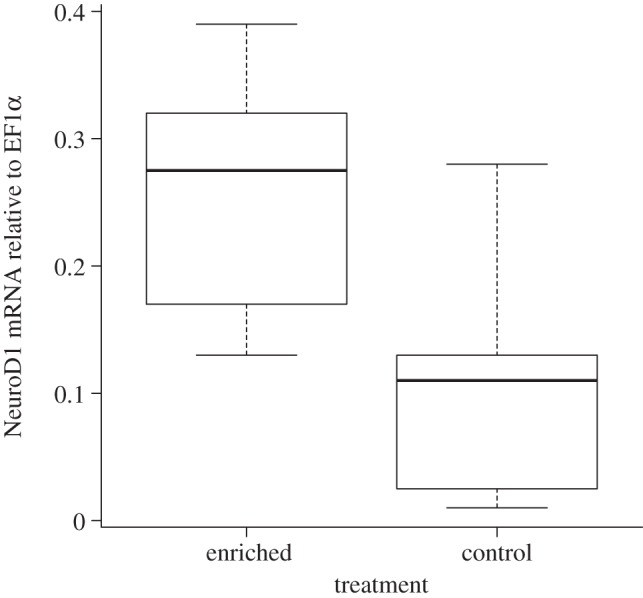
Juvenile Atlantic salmon reared in tanks with spatial structures (enriched) had higher levels of NeuroD1 mRNA expression relative to EF1α (p = 0.03). The values portrayed are the standard box-and-whisker plot in R (i.e. the box shows median, and first and third quartiles, and the whiskers represent min and max values). There were no outliers in the data.