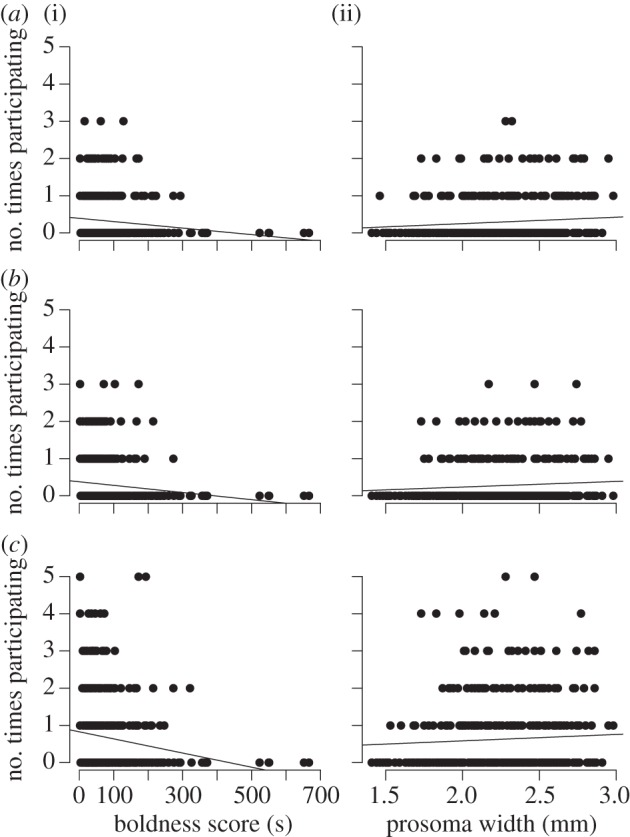
Figure 1.

Graphs depicting the number of times spiders participated in 10 simulated prey capture events plotted against (i) boldness (measured as latency to resume movement after air puffs, hence low values reflect high levels of boldness) and (ii) prosoma width (reflecting body size). Prey capture participation was measured in three ways: as (a) the first spider to emerge from the colony, (b) the first spider to attack and (c) whether spiders were out at the time of attack. Note that the plots and trend lines do not directly reflect the results from the statistical models where random effects were taken into account.
