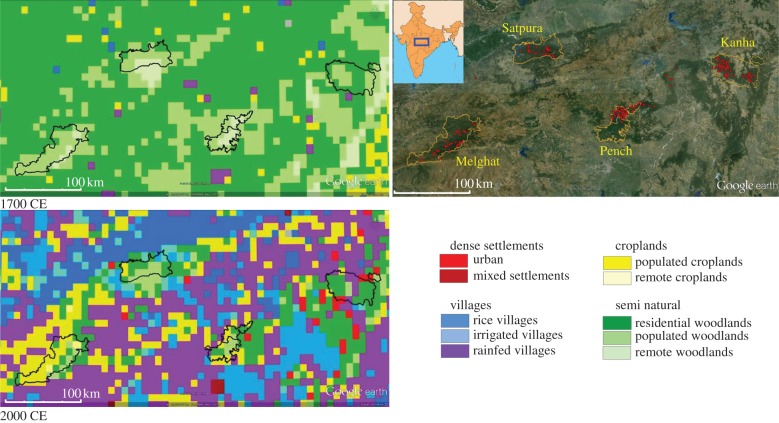
Figure 1.
Satpura–Maikal landscape in central India and land cover in 1700 and 2000 CE. The Satpura–Maikal landscape (right side) and its location in India (inset). Red dots represent the locations of the individual tigers identified in each tiger reserve (orange boundary) and corridors using multi-locus genotype data. The two figures on the left side are Anthrome 2.0-generated maps of land cover for the years 1700 and 2000 in the Satpura–Maikal landscape and show the dramatic change in the landscape in the past 300 years.

