
Figure 2.
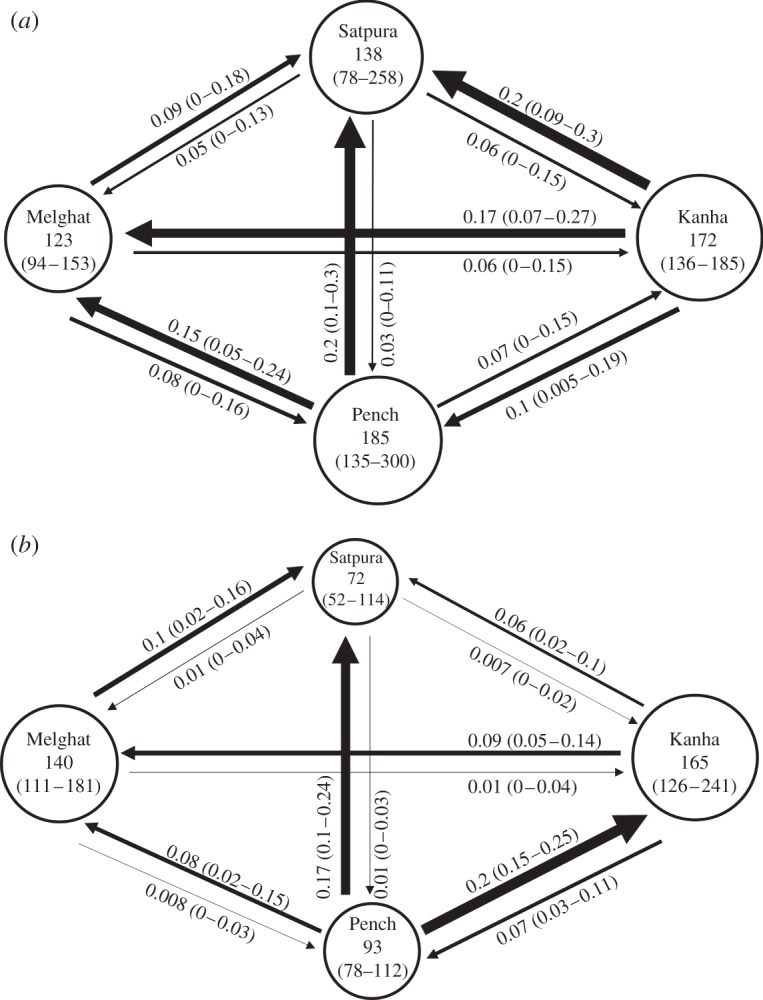
(a) Historical and (b) contemporary gene flow pattern in the Satpura–Maikal landscape. The arrows show the direction of gene flow and their thickness represents the magnitude of gene flow, which is also shown numerically along the arrows, with the 95% CI in parentheses. Circle size represents effective population size (Ne). The value inside the circle is Ne with the 95% CI in parentheses.