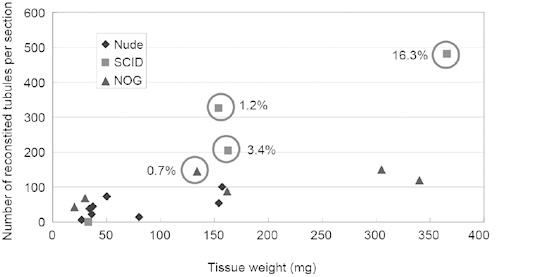
Figure 2.

Relationship of spermatogenesis development to tissue weight, the number of seminiferous tubules in a tissue section and the type of recipient mouse as presented in a dot graph. The x axis indicates the weight of the reconstituted transplants. The y axis indicates the number of tubules counted in a section of the transplants. A circle indicates the presence of complete spermatogenesis. Percentage figures beside the circle indicate the frequency of seminiferous tubules having elongated spermatids among all sections of tubules counted. This graph suggests that the chance of spermatogenesis development increased with the number of reconstituted tubules in a tissue derived from transplanted cells. NOG, NOD/Shi-SCID, IL-2Rγcnull; SCID, severe combined immunodeficient.
