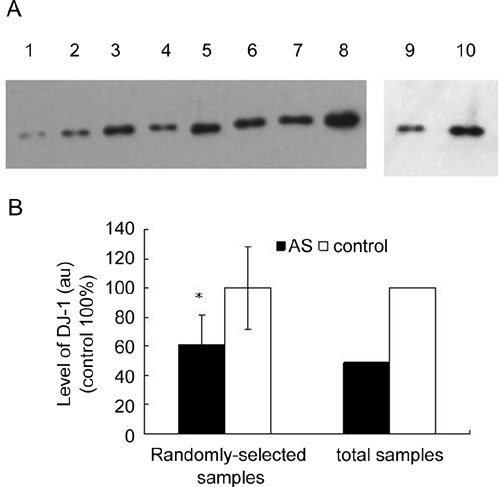
Figure 2.

Levels of DJ-1 in seminal plasma, as analysed by immunoblot. (A): 50 μg of seminal plasma protein from asthenozoospermia(AS) patients and healthy donors was loaded onto each lane. Each sample loaded onto lanes 1–4 and lanes 5–8 was a mixture of two randomly selected seminal samples with the same amount of protein from AS patients and healthy donors, respectively. The mixtures of seminal plasma with the same amounts of protein from 38 AS patients and 20 normal controls were loaded onto lanes 9 and 10, respectively. These samples were subjected to immunoblot analysis with the primary antibody against DJ-1 after being separated in SDS-PAGE. (B): The above band intensity was measured using the Gel Imagine Scan System. The density was expressed as a percentage of that of the control group. *P < 0.05, compared with the corrresponding control. au: arbitrary units.
