
Figure 2.
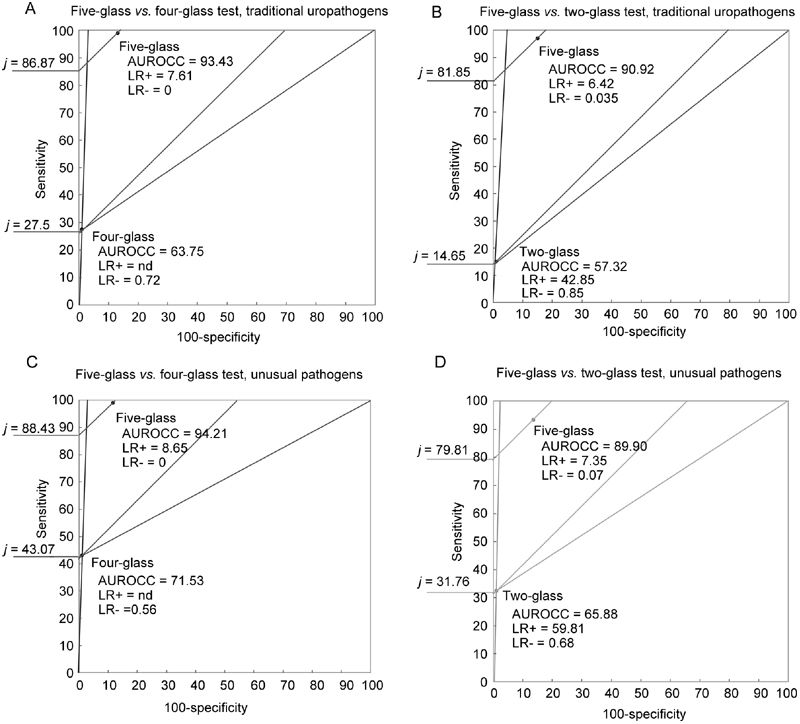
Likelihood ratio graphs comparing the four-glass Meares and Stamey test with the five-glass test and the two-glass PPMT with the five-glass test for the detection of traditional uropathogens or unusual pathogens. AUROCC, area under receiver operator characteristic curve; j, Youden's Index; LR+, likelihood ratio for a positive test; LR−, likelihood ratio for a negative test.