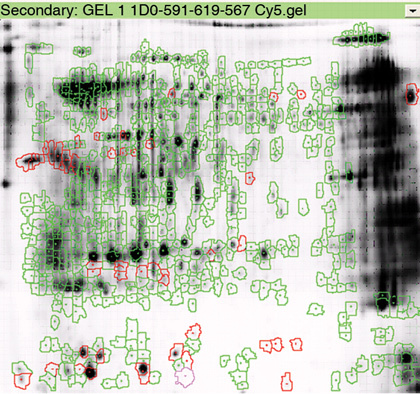
Figure 2.

A representative image showing the differential protein expression of normal and round-headed human sperm. The red circles represent the locations of differentially expressed protein spots. Using differential in-gel analysis (DIA), the Cy2, Cy3 and Cy5 images of each gel were merged, spot boundaries were automatically detected and normalized spot volumes (protein abundance) were calculated. Using biological variation analysis (BVA), matching of the protein spots across two gels was performed after several rounds of extensive landmarking and automated matching. After BVA, up to 36 spots were found to have differential expression between the two pools (P < 0.01, AV > 3).
