
Figure 2.
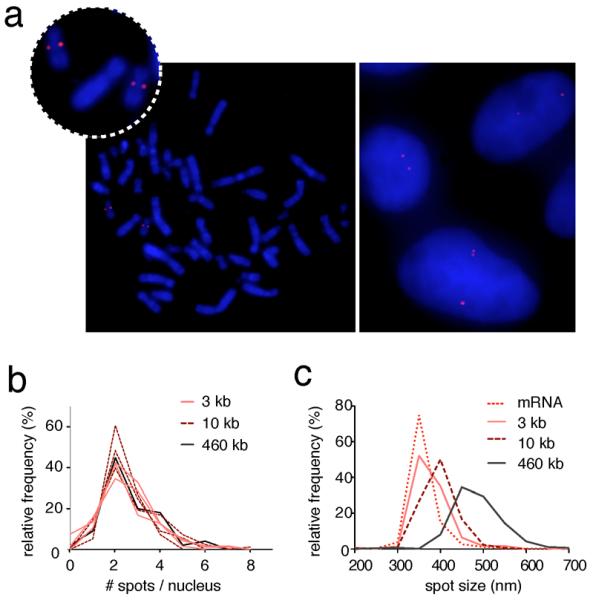
Specificity and sensitivity of HD-FISH. (a) Human HER2 locus (red) visualized in metaphase spreads (left) and HME cells (right) using a 10 kb ETS probe. Blue: DAPI. (b) Distributions of spot counts for three loci on chromosome 17 including HER2, visualized with 10 vs. 3 kb ETS probes, and with a HER2 commercial probe spanning 460 kb. (c) Distribution of spot sizes for the same HER2 probe as in (a). mRNA: diffraction-limited HER2 mRNA molecules detected by smRNA-FISH.