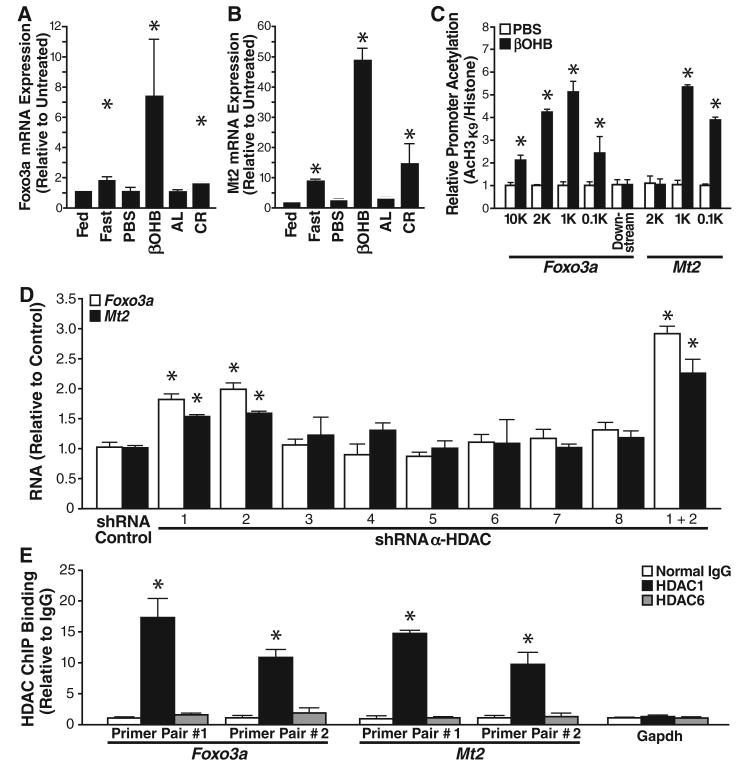
Fig. 3.
Increased expression of oxidative stress resistance genes in cells exposed to βOHB. (A) Expression of Foxo3a under various conditions (see Fig. 2 for details) measured by QPCR. Foxo3 expression is normalized to abundance of glyceraldehyde-3-phosphate dehydrogenase (GAPDH). Mean ± SE, *P < 0.05 by t test between paired conditions. (B) Expression of Mt2, measured as in (A). (C) Promoters of Mt2 and Foxo3a are enriched for acetylated his-tone H3K9 after βOHB treatment. HEK293 cells were treated with 10 mM βOHB or PBS for 24 hours. Chromatin was immunoprecipitated with anti-H3 or anti-AcH3K9, and the purified DNA was analyzed with primer pairs specific for the Foxo3a or Mt2 promoters. Results are the ratios of AcH3K9 to total histone H3. Mean ± SE, *P < 0.05 by t test between βOHB and PBS conditions. (D) HDAC depletion increases Foxo3a and Mt2 mRNAs abundance. HEK293 cells were transfected with shRNAs specific for each class I or class II HDAC, and mRNA abundance was measured by QPCR 72 hours after transfection. Mean ± SE, *P < 0.05 by t test versus control shRNA. (E) HDAC1, but not HDAC6, is enriched at the promoters of Mt2 and Foxo3a. ChIP analysis of the Foxo3a and Mt2 promoters (two primer pairs per promoter) and Gapdh (one primer pair) from HEK293 cells with control immunoglobulin G (IgG), anti-HDAC1, or anti-HDAC6. Relative promoter binding of each HDAC is normalized to input Gapdh. Mean ± SE, *P < 0.05 by t test versus IgG control.

