FIG. 4.

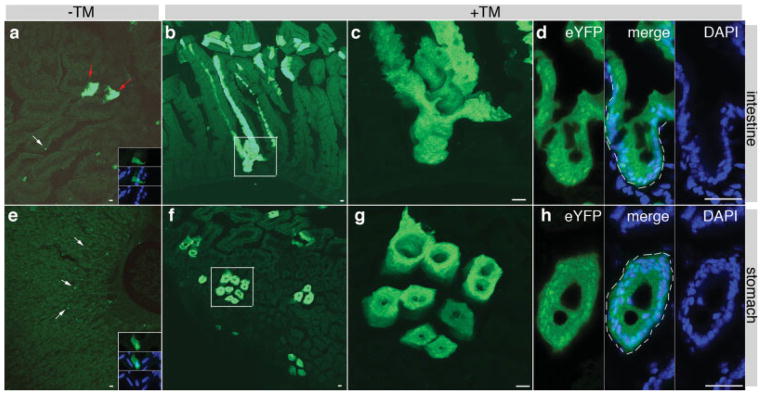
K19CreERT labels putative gut stem cells. Direct fluorescence showed gut EYFP expression 6 weeks after 0.5 mg TM injection at P3. (a–d) Intestine. (e–h) Stomach. (a and e) No TM administration. Low magnification pictures were provided for a global view on the leakiness of K19CreERT deletor. White arrows point to single cells. Red arrows point to two cell clusters. Insets in (a) and (e) are high amplification of single YFP+ cells costained with DAPI. EYFP, DAPI, and a merge channel were shown. (b–d and f–h) EYFP expression after TM administration. (c) and (g) are amplified areas (boxed) in (b) and (f), respectively. (d) and (h) showed an intestinal crypt and a gastric gland, respectively. Cells were stained with DAPI to show nucleus of each cell. Note that in the crypt or gland (white broken lines), all cells are EYFP+. Bars = 40 μm.
