
Figure 4. CCT1 Shuttles between Nucleus and Cytosol before Oleate Loading but Stably Associates with LDs during Their Expansion.
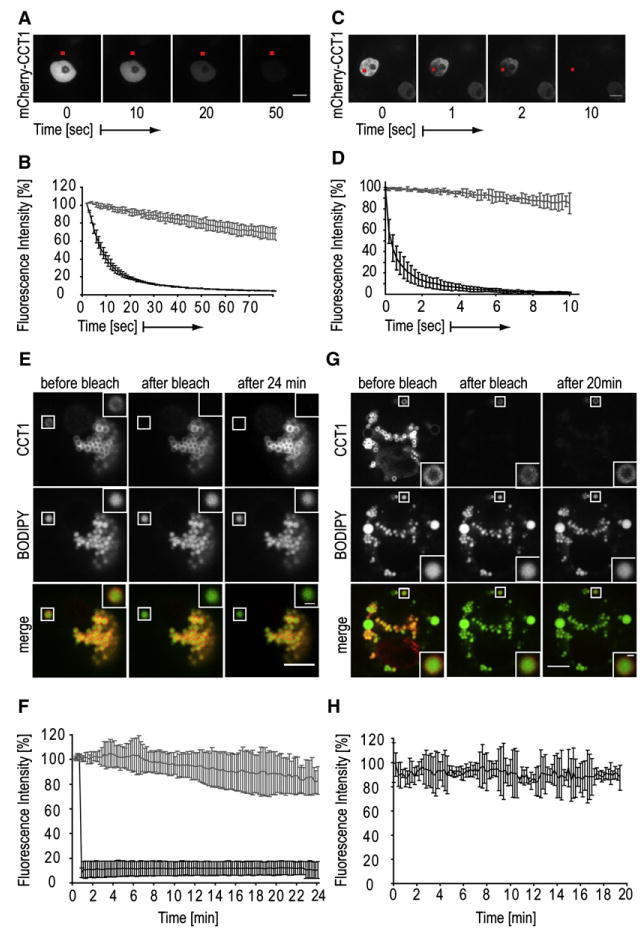
(A and B) mCherry-CCT1 shuttles between nucleus and cytosol as seen in images (A) and quantitation of three FLIP experiments (B; means ±SD are shown) in which a spot in the cytosol was repeatedly bleached.
(C and D) CCT1 is mobile in the nucleus. A FLIP experiment analogous to (A) and (B) is shown, but a spot in the nucleus was bleached repeatedly.
(E) mCherry-CCT1 fluorescence (upper panels) of a bleached LD (shown in lower panels) does not recover. Box indicates the photobleached LD, which is shown in higher magnification. Prebleach (left), immediately after bleach (middle), and postbleach (right) images of the experiment are shown.
(F) Normalized fluorescence intensity of mCherry-CCT1 on a bleached LD as in (C) over time. Values are means ±SD of three experiments.
(G) mCherry-CCT1 (upper panels) fluorescence remains stable on LD (BODIPY labeled, middle panels) in a bleached cell. Lower panels show overlays of the two channels. At time 0 min, all signal except on the indicated LD was photobleached. Prebleach (left), immediately after bleach (middle), and postbleach (right) images of the FRAP experiment are shown.
(H) Normalized fluorescence intensity of mCherry-CCT1 of experiments as in (G) over time. Values are mean ±SD of three experiments. Bars, 5 μm.