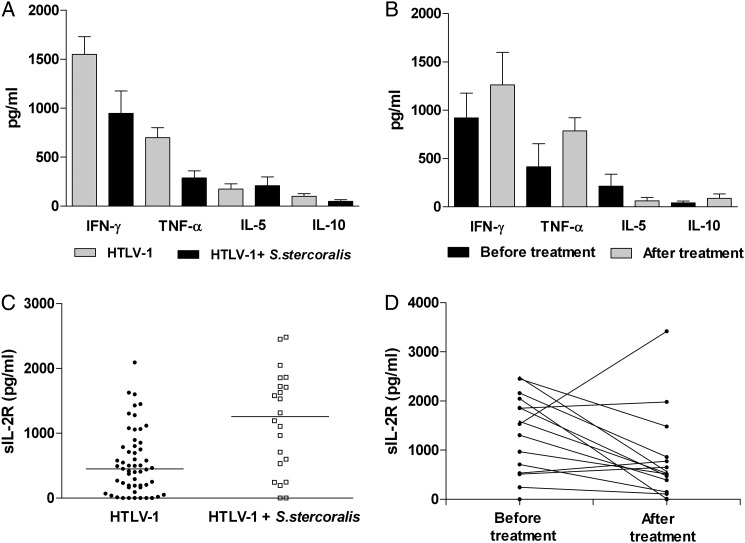
Figure 1.
Cytokine profile and sIL-2R levels in patients with human T cell lymphotropic virus type 1 (HTLV-1) with or without strongyloidiasis before and after treatment for strongyloidiasis. (A) The levels (median; range) of IFNγ and TNFα were higher in the 60 HTLV-1 patients without strongyloidiasis (1144 pg/ml; 0–6025 pg/ml and 485 pg/ml; 0–4686 pg/ml, respectively) than in the 26 HTLV-1 patients with strongyloidiasis (744 pg/ml; 0–4538 pg/ml and 113 pg/ml; 0–1157 pg/ml, respectively) (p < 0.05; Mann-Whitney U test). (B) There was an increase in TNFα levels after strongyloidiasis treatment (885 pg/ml; 0–1642 pg/ml) compared with levels before treatment (109 pg/ml; 0–4145 pg/ml) (p < 0.05; Wilcoxon Signed-Rank Test). (C) The levels of sIL-2R in the serum of 22 patients with HTLV-1 and strongyloidiasis (1255 pg/ml; 0–2483 pg/ml) were higher than in the 55 patients with HTLV-1 without strongyloidiasis (452 pg/ml; 0–2094 pg/ml) (p < 0.05; Mann-Whitney U test). (D) Higher levels of sIL-2R were noted before anthelmintic treatment (1532 pg/ml; 0–2438 pg/ml) than after it (527 pg/ml; 0–3419) (p < 0.05; Wilcoxon Signed-Rank test).

