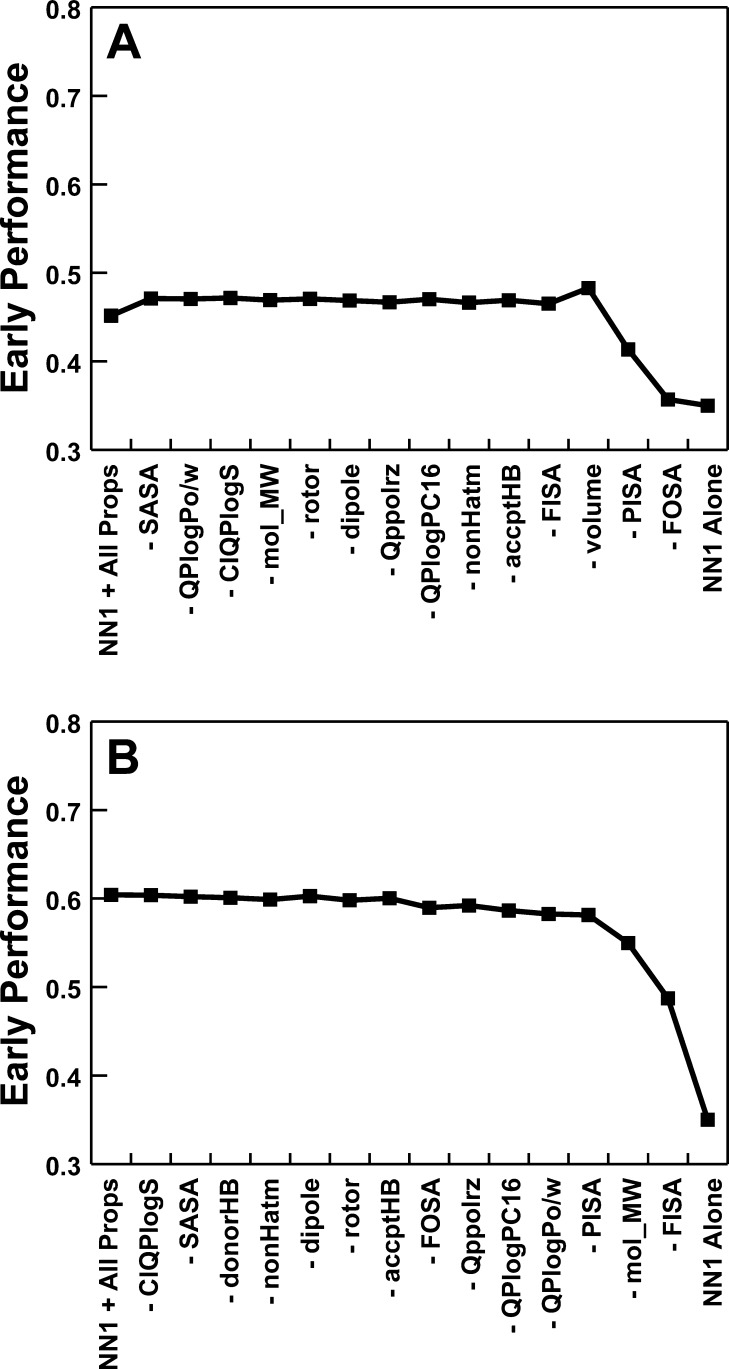
Figure 2.
Screen performance when composite scoring functions were used. In each graph, the leftmost data point describes the average performance over all 40 DUD receptors when a composite function that incorporates the Vina–NN1 score together with 15 small-molecule properties is used. Advancing rightward, composite functions are used that progressively incorporate fewer chemical properties. The rightmost data point shows screen performance when Vina–NN1 alone is used. (A) Single general-purpose function. (B) Independent composite scoring functions generated for each receptor.

