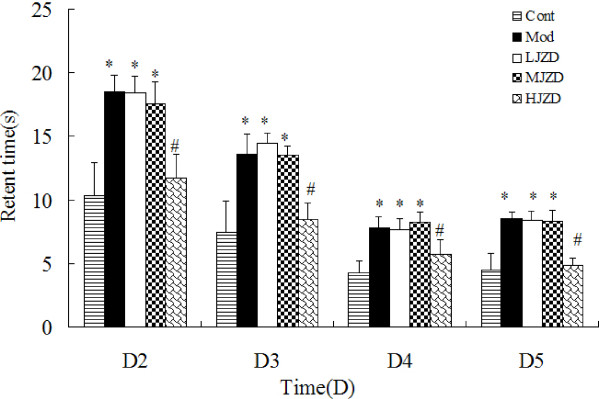
Figure 3.

Effect of JZD on escape latency during the Morris water maze test in DACD rats. Graphs show mean time ± SD taken to reach the platform (escape latency) for Days 2 through 5. A significant decrease in the escape latency to reach the platform was found on Days 2 through 4 and remained stable on Day 5. Factorial ANOVA showed that the Cont and HJZD groups had a significantly lower retent time on days 2–5 than the other groups. Data are represented as means ± SD, *p < 0.05 vs. the Cont group, #p < 0.05 vs. the Mod group.
