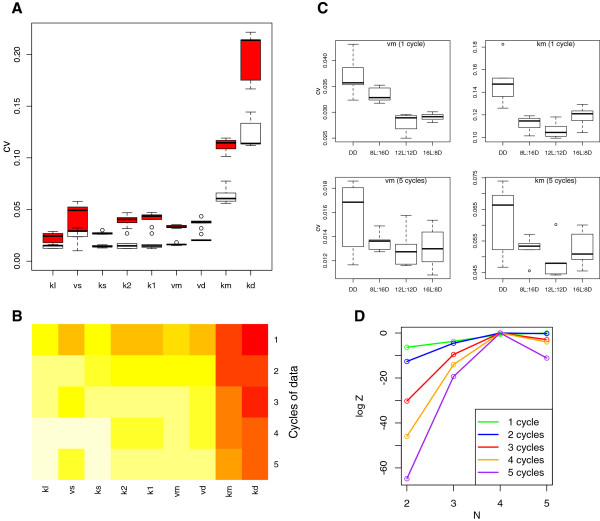
Figure 4.
Coefficients of variation.A. The cvs for nine model parameters inferred from one cycle (red) and three cycles (white) of DD data. B. A heat map showing −log(cv) for all parameters and cycle lengths on the colour scale white (low cv) through to red (high cv). C. The cvs for model parameters vm and km for constant darkness (DD), 8, 12 and 16 hour days, inferred from 1 and from 5 cycles of data. D. Calculated log Z values for 1–5 cycles of DD data. The maximum log Z in each series (cycle length) is set to 0 to facilitate comparison.

