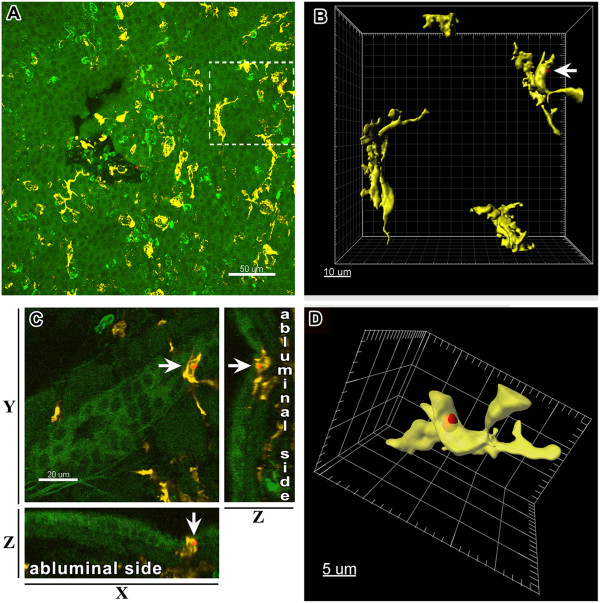
Figure 5.
Capture of conidia by the conducting airway epithelial DCs. (A) Three-dimensional reconstitution of the image stacks taken from the proximal ventral region of the conducting airway showing the distribution of Ly-6G+ neutrophils (bright green), epithelium auto-fluorescence (dark green), MHC II+ APCs (yellow), and A. fumigatus conidia (red) in an OVA/PBS mouse at 8 hours post-conidial application. Scale bar = 50 μm. (B) Three-dimensional reconstitution of the area indicated on (A) representing MHC II+ APCs (yellow) and A. fumigatus conidia (red: arrow); scale bar = 10 μm. (C) X, Y, and Z-projections of the area framed in (A) showing the precise location of an intraepithelial (epithelium auto-fluorescence, green) and epithelial DC (yellow) that internalized A. fumigatus conidia (red: arrow). Scale bar = 20 μm. (D) An epithelial DC that internalized conidia is represented as the enlarged and arbitrary rotated three-dimensional surface object. Scale bar = 5 μm.

