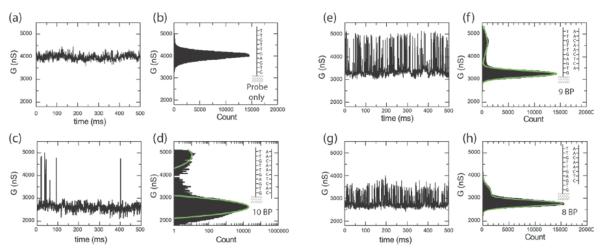
Figure 2. Real time measurements of binding kinetics with different target DNA.
Real-time conductance recording at Vsd=100mV and VPt=−0.3V showing a small interval from an 8 minute recording. a Conductance recording in 1X PBS buffer solution without target DNA. c,e,g Conductance recording with 10, 9 and 8 base pair complementary target DNA. b,d,f,h Conductance based histograms from 30 s time intervals (of which Fig. 2a,b,e,f are small subsets).

