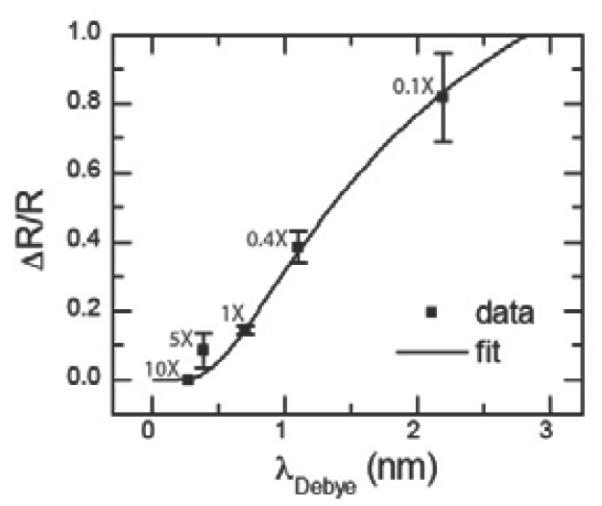
Figure 4. Effect of Debye length.

Normalized resistance change as a function of buffer concentration. Increasing the buffer concentration will reduce the Debye length so that more of the DNA's negative charge will be screened by counterions. Error bars are calculated from at least 5 different 30s time interval histograms.
