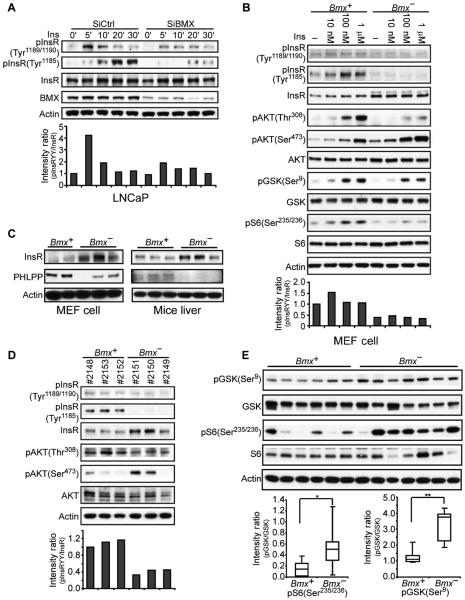
Fig. 6. BMX regulates the phosphorylation and signaling of the InsR.
(A) LNCaP cells transfected with BMX-targeted or nontargeted control siRNA were serum-starved for 48 hours, then stimulated with insulin (Ins; 100 nM) for 0 to 30 min, and immunoblotted for pTyr1189/1190 or pTyr1185 InsR. Intensities of the pInsR Tyr1189/1190 versus total InsR bands in this experiment are in the bottom panel. From three independent experiments at 5 to 10 min of stimulation, the mean pInsR Tyr1189/1190 intensity in the control versus BMX siRNA–transfected cells was 2.13 ± 0.42 SEM (P < 0.05). (B) Bmx+ and Bmx− MEFs were serum-starved for 48 hours and then stimulated with insulin for 10 min, and whole-cell lysates were immunoblotted as indicated. From three independent experiments, the mean pInsR Tyr1189/1190 intensity in control versus BMX siRNA–transfected cells treated with 100 nM insulin was 2.49 ± 0.13 SEM (P < 0.001). (C) Whole-cell lysates from independent Bmx+ and Bmx− MEF cell lines or livers were blotted as indicated. (D) After an overnight fast, 8- to 10-month-old Bmx+ and Bmx− mice were injected intraperitoneally with glucose (2 g/kg). Liver was harvested after 15 min, and lysates were immunoblotted. The normalized mean pTyr1189/1190 intensity in the three Bmx+ versus three Bmx− mice was 1.12 versus 0.41 (P < 0.01). (E) Equal amounts of liver protein extracts from Bmx+ and Bmx− mice at 15 min after glucose challenge were blotted for GSK3β pSer9 and S6 pSer235/236. Signals were quantified and further normalized to actin, and quartile plots are shown (*P < 0.05, **P < 0.01).

