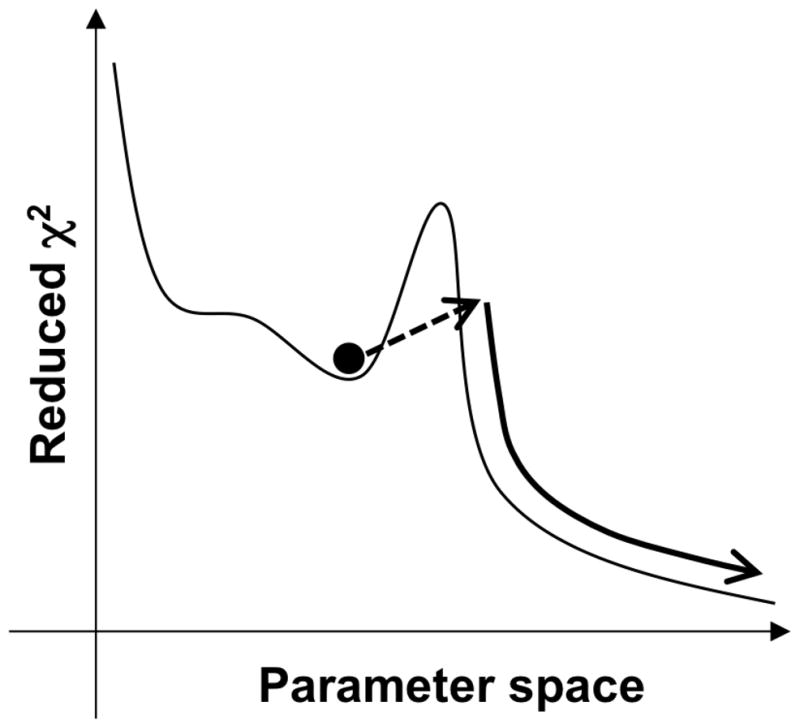
Figure 1.

Schematic representation of the Monte-Carlo minimization method implemented in GLOVE. The dashed line arrow represents the Monte-Carlo process that adds random values to the current best fit parameters, enabling the parameters to pass through a local minimum. The reduced χ2 value usually increases in this step. The new parameter set is subsequently minimized as represented by the curved solid arrow.
