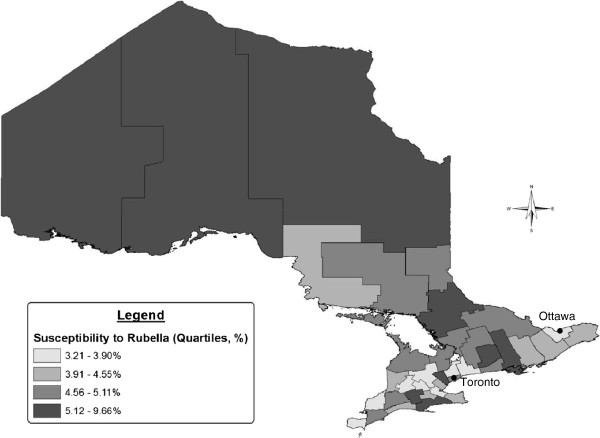
Figure 3.
Rubella susceptibility among 15–49 year old females in Ontario by health unit, 2006–2010 (N = 455,745 patients, excluding 4,218 patients for whom health unit could not be determined). The geographic distribution of Ontario women who remained susceptible to rubella throughout the study period between 2006 and 2010 is presented in this figure. The health unit reflects the patient’s place of residence where available, otherwise the health unit of the health care provider who submitted the request for the prenatal test is shown. The numerator includes women who had a single test that demonstrated susceptibility, as well as women who had multiple tests that all demonstrated susceptibility. Health units were categorised according to quartiles of susceptibility. In general, women residing in the northern health units had the highest levels of susceptibility.

