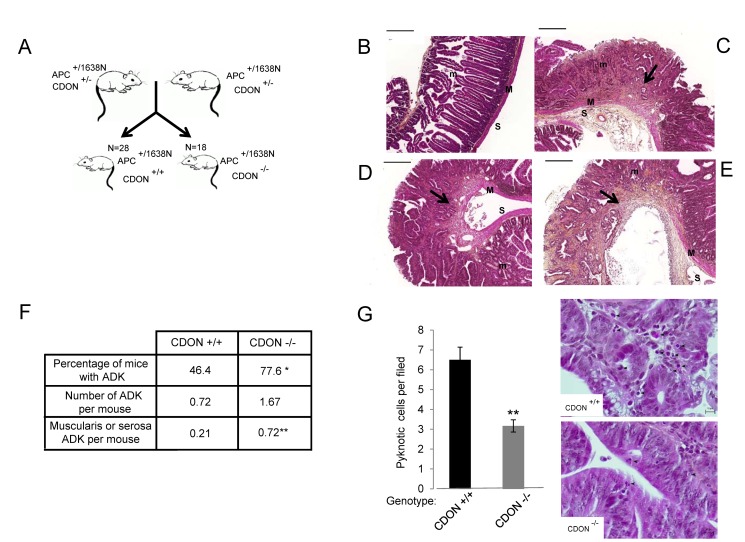
Figure 4. CDON is a bona fide tumor suppressor.
(A) Cohorts of CDON−/− APC+/1638N mice were generated to analyze the effect of CDON genetic invalidation on intestinal tumorigenesis compared to CDON+/+ APC+/1638N. (B–E) Representative images of Haematoxylin–Eosin–Saffron (HES) staining of normal intestinal epithelium (B) compared to adenocarcinomas with mucosa (C) muscularis (D) or serosa (E) local invasion observed in CDON−/− APC+/1638N mice. m, mucosa; M, muscularis; S, serosa; scale bar, 200 µm. (F) Frequency and incidence of adenocarcinomas (ADK) in CDON+/+ APC+/1638N mice (n = 28) compared to CDON−/− APC1638N mice (n = 18). Tumour classification was performed according to international recommendations (χ2 test; *p<0.05 and Student t test; **p<0.01). (G) Cell death was quantified in high grade adenomas from three mice of each genotype. Representative images of pyknotic cells from HES CDON+/+ APC+/1638N mice compared to CDON−/− APC+/1638N mice are shown in right panels. Scale bar, 10 µm. Error bars indicate s.e.m. Statistical treatment of the data was performed using a two-sided Mann–Whitney test (**p<0.01).

