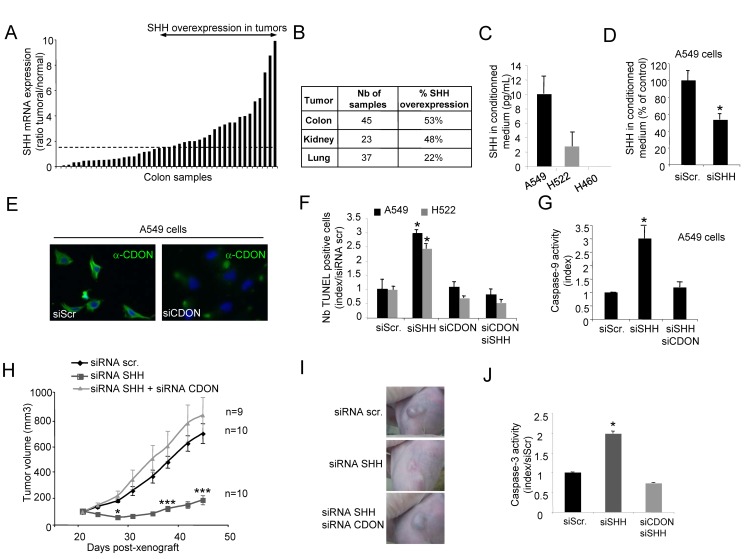
Figure 5. Inhibition of SHH triggers cancer cell death via CDON-induced apoptosis.
(A) Quantification of SHH expression by Q-RT-PCR in a panel of 45 human colorectal tumors and paired normal tissues. Data are presented as a ratio of SHH expression between tumor and normal tissue for each sample. Overexpression of SHH is considered when more than a 1.5-fold increase in the tumor is observed (indicated by the dashed line). (B) Quantification of SHH expression by Q-RT-PCR in a panel of 105 human tumors. Each tumor sample was compared to a normal paired tissue. For each type of tissue, the percentage of tumors showing an increase in SHH (considered when a more than 1.5-fold increase in expression is observed as compared to the normal tissue) is indicated. (C) Quantification of endogenous secreted SHH by ELISA assay in A549, H522, and H460 cells culture medium. H460 cell line is presented as a negative control. (D) Quantification of endogenous secreted SHH by ELISA assay in the culture medium of A549 cells transfected with scramble or SHH siRNA. (E) CDON immunofluorescence staining of A549 cells transfected with scramble or CDON siRNA using a CDON-specific antibody (in green) as described in the methods section. Nuclei were stained with Hoechst (in blue). (F) Apoptotic cell death induction as measured by TUNEL staining was quantified in A549 and H522 cells transfected with SHH siRNA alone or together with CDON siRNA. (G) Caspase-9 activity was measured in A549 cells 18 h after transfection with SHH siRNA alone or together with CDON siRNA. (H) Nude mice were engrafted with A549 cells by subcutaneous injection of 10 million cells. When the mean tumor volume reached approximately 100 mm3, animals were treated twice a week by i.p. injection of scramble or SHH siRNA alone or in combination with CDON siRNA during 4 wk. Mean tumor volume and number of animals for each group are indicated. (I) Representative images of scr siRNA, SHH siRNA, or SHH siRNA+CDON siRNA-treated tumors on day 35. (J) Apoptosis quantification by caspase-3 activity assay on xenografted tumor lysates analyzed after 1 wk of treatment with siRNAs. For (H), error bars indicate s.e.m. Statistical treatment of the data was performed using a two-sided Mann–Whitney test compared to scramble siRNA-treated condition (*p<0.05; ***p<0.001). For (D), (F), (G), and (J), data are means of a minimum of three independent assays. Error bars indicate s.d. Statistical treatment of the data was performed using a two-sided Mann–Whitney test compared to scramble siRNA-transfected condition (*p<0.05).

