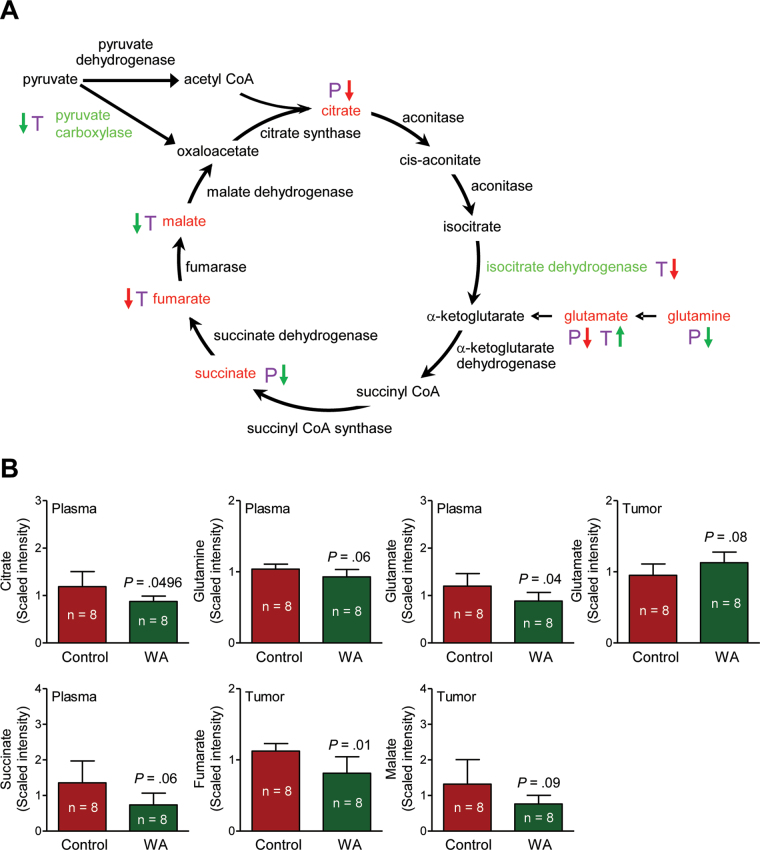
Figure 7.
Withaferin A (WA)–mediated alterations in the levels of tricarboxylic acid (TCA) cycle intermediates in the plasma and/or tumor of mouse mammary tumor virus-neu mice. A) TCA cycle. B) Levels of TCA cycle intermediates in plasma and/or tumors of mice from the WA treatment group and the control group. Plasma and tumor samples from 8 different mice of each group were outsourced to Metabolon (Durham, NC) for metabolic profiling. The letters P (purple) and T (purple) represent plasma and tumor, respectively. A red arrow denotes P less than .05, and a green arrow denotes P greater than or equal to .05 and P less than .10. TCA cycle intermediates with differences between the WA treatment group and the control group are indicated with red font. TCA cycle–related proteins with differences in expression between the WA treatment group and the control group are indicated with green font. Bar graphs represent the mean scaled intensity of the intermediates (n = 8) with their 95% confidence intervals (error bars). acetyl CoA = acetyl coenzyme A; succinyl CoA = succinyl conenzyme A; succinyl CoA synthase = succinyl coenzyme A synthase.

