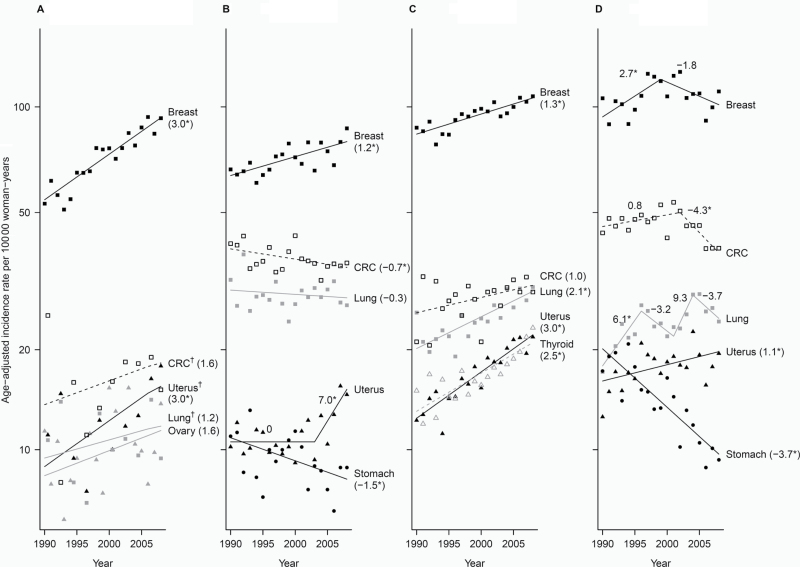
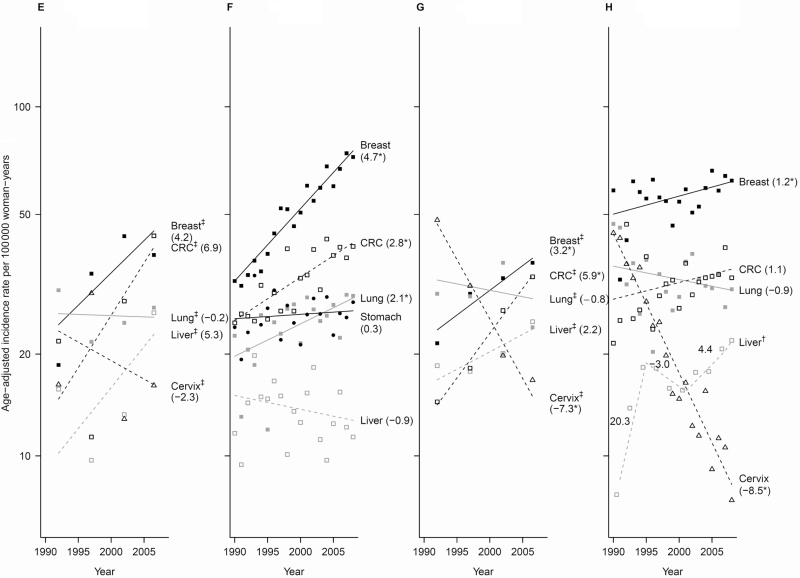
Figure 2.
Trends of incidence rates and annual percentage change for the top five cancer sites among each Asian American ethnic group, 1990–2008, women. Cancer sites are represented by the following plot symbols: breast: solid black squares and lines; lung: solid gray squares and lines; colorectal cancer (CRC): open black squares and dashed black lines; liver: open gray squares and dashed gray lines; stomach: solid black circles and lines; uterus: solid black triangles and lines; ovary: solid gray triangles and lines; cervix: open black triangles and dashed black lines; thyroid: open gray triangles and dashed gray lines. Data above are shown by racial/ethnic group: A) Asian Indian/Pakistani (95% confidence intervals [CIs] for the annual percentage change (APCs) are: Breast: 2.4 to 3.6; CRC: −1.6 to 4.8; Uterus: 0.3 to 5.8; Lung: −2.0 to 4.5; Ovary: −1.2 to 4.5); B) Chinese (95% CIs for the APCs are: Breast: 0.6 to 1.9; CRC: −1.3 to −0.02; Lung: −1.1 to 0.5; Uterus segment 1: −1.7 to 1.7, segment 2: 1.4 to 12.9; Stomach: −2.8 to −0.2), C) Filipina (95% CIs for the APCs are: Breast: 0.9 to 1.7; CRC: −0.03 to 2.0; Lung: 1.4 to 2.8; Uterus: 2.4 to 3.7; Thyroid: 1.7 to 3.3); D) Japanese (95% CIs for the APCs are: Breast segment 1: 0.2 to 5.4, segment 2: −4.1 to 0.6; CRC segment 1: −0.4 to 1.9, segment 2: −7.1 to −1.3; Lung segment 1: 2.5 to 9.8, segment 2: −8.2 to 2.1, segment 3: −7.6 to 29.2, segment 4: −8.2 to 1.1; Uterus: 0.1 to 2.0; Stomach: −4.8 to −2.6), E) Kampuchean (95% CIs for the APCs are: Breast: −5.9 to 15.4; CRC: −7.8 to 23.9; Lung: −6.1 to 6.2; Liver: −9.2 to 22.2; Cervix: −18.3 to 16.8), F) Korean (95% CIs for the APCs are: Breast: 4.0 to 5.4; CRC: 1.7 to 3.9; Lung: 0.6 to 3.6; Stomach: −0.8 to 1.4; Liver: −2.6 to 0.9, G) Laotian (95% CIs for the APCs are: Breast: 0.04 to 6.4; CRC: 4.0 to 7.7; Lung: −10.1 to 9.5; Liver: −1.3 to 6.0; Cervix: −10.4 to −4.1), H) Vietnamese (95% CIs for the APCs are: Breast: 0.1 to 2.2; CRC: −0.4 to 2.5; Lung: −2.3 to 0.6; Liver segment 1: −9.2 to 59.5, segment 2: −16.5 to 12.7, segment 3: −0.2 to 9.2; Cervix: −9.5 to −7.4). An * indicates the 95% confidence interval for the APC does not include zero. † Joinpoint and observed rates are based on 2-year groups (1990–1991, 1992–1993, 1994–1995, 1996–1997, …, 2008). ‡Joinpoint and observed rates are based on 5-year groups (1990–1994, 1995–1999, 2000–2004, 2005–2008). Cervix = cervix uteri; CRC = colon and rectum; Liver = liver and intrahepatic bile duct; Lung = lung and bronchus; Uterus = corpus and uterus.


