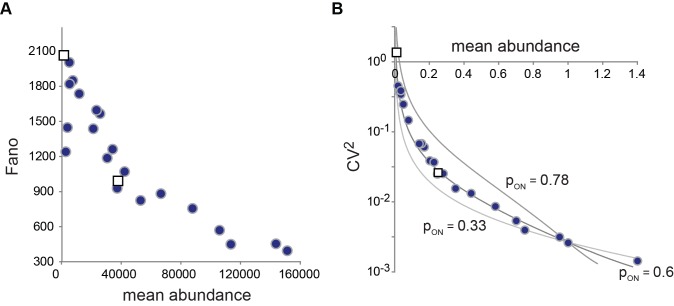
Figure 6. Noise profiles of PHO5 expression.
The results of intrinsic protein noise measurements [15] are indicated by blue dots for strains with mutations in the Pho4 activation domain, and white squares for pho5 UASp1 and UASp2 mutants. Intrinsic noise was measured [15] using the dual reporter system [1], where cyan fluorescent protein (CFP) and yellow fluorescent protein (YFP) were expressed in diploid cells under control of the PHO5 promoter. (A) Fano factor profile of PHO5 protein noise; Fano factor and mean abundance are indicated in molecule numbers, based on the assumption that the average number of protein molecules expressed under repressing conditions is 1,000 per cell [24]. (The exact number is unimportant to our principle conclusions.) (B) CV
2 profile of PHO5 protein noise. Mean (protein) abundance is in units of wild type expression. Curves represent predictions based on the two-state model (Figure 1A), with the burst frequency α as the regulatory parameter, and different probabilities of the ON state in wild type (p
ON). For all calculations,  min−1,
  h−1,
h−1,  h−1 (see Figure 1A, and main text below; like Pho5, CFP and YFP are biochemically stable; the proteins are lost therefore primarily due to dilution by cell division). With
  , the kinetic parameter for transcription is
  min−1. The parameter values were determined as described in the main text.

