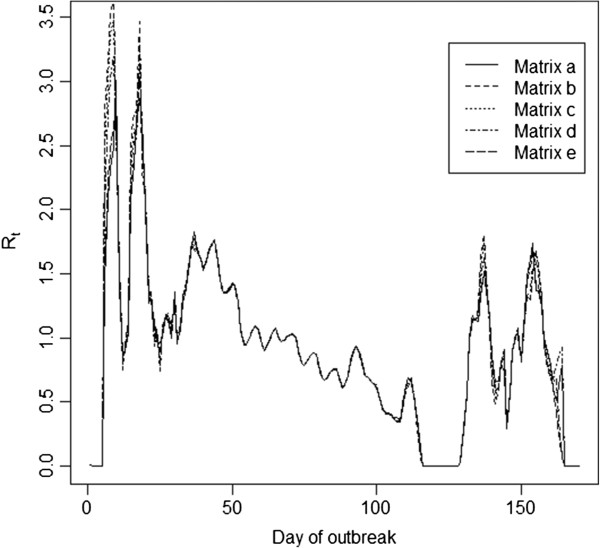
Figure 3.

Estimates of Rt using the transmission matrices, as described in the text. The estimates shown represent the average of the Rt estimates obtained across the 500 imputed epidemics. Days when no cases were reported have a Rt of 0, though we smooth through this for the purpose of visual presentation.
