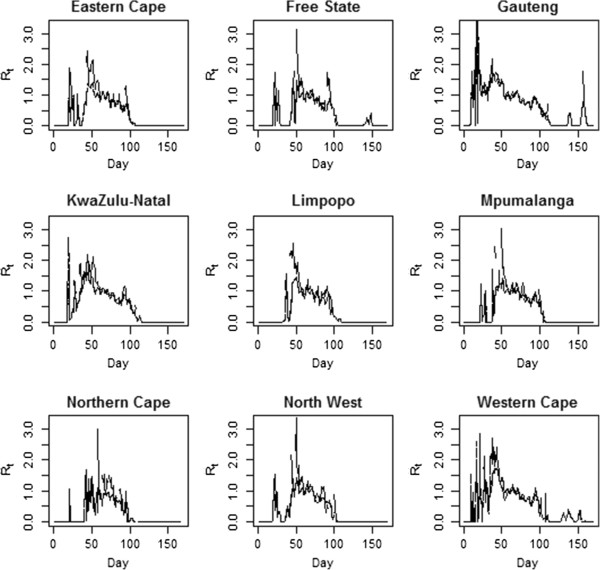
Figure 4.

Estimated Rt by province. The line types for each plot are the same as those used in the previous figure. Days when no cases were reported have a Rt of 0, though we smooth through this for the purpose of visual presentation.

Estimated Rt by province. The line types for each plot are the same as those used in the previous figure. Days when no cases were reported have a Rt of 0, though we smooth through this for the purpose of visual presentation.