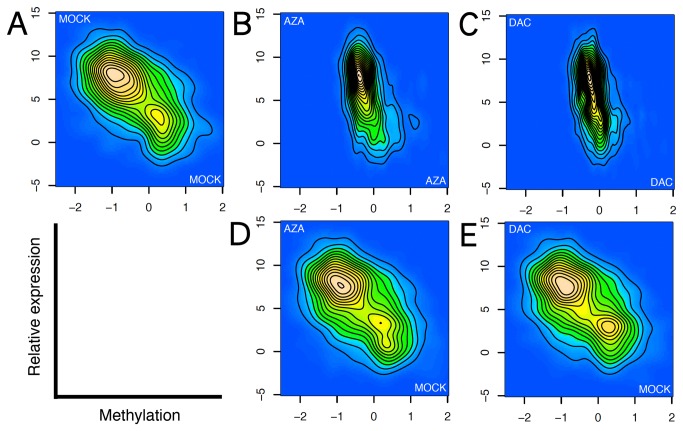
Figure 3. Correlation of gene expression and promoter CGI methylation.
A) MOCK-MOCK (B), AZA-AZA (C), DAC-DAC (D), AZA-MOCK (E), and DAC-MOCK. Two-dimensional kernel density estimates of expression level (log2 transformed Mas5 estimates) and methylation levels (mean log2-ratios for the complete island) for a set of low-density CGIs associated with transcriptional start regions (from a total of 198302 probes). Methylation is on the x-axis, expression level on the y-axis. Top row shows plots for methylation plotted against expression levels within individual samples, bottom row shows expression levels in two treated samples plotted against methylation levels obtained from a single control sample as indicated. All plots are from a single representative sample.

