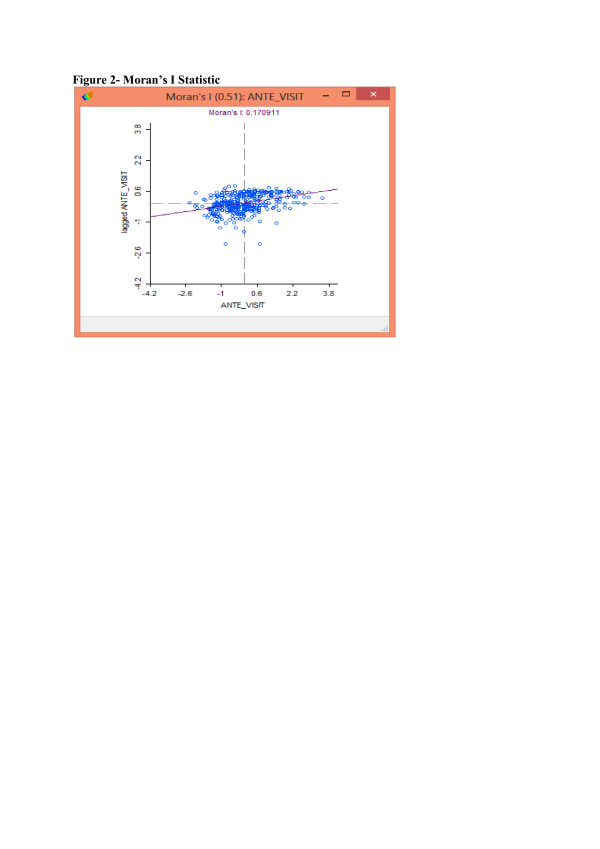
Figure 2.
Moran’s I Statistic. The exploratory spatial data analysis is begun with the construction of a Moran’s I scatter plot, shown in Figure 2. This has the variable of interest (number of antenatal care visits) on the x-axis and the spatial lag (weighted average of neighbouring villages’ antenatal care visits) on the vertical axis. The Moran’s I statistic is a ‘global’ measure of spatial autocorrelation over the entire sample population. A positive Moran’s I statistic indicates a positive spatial autocorrelation where villages with a high (low) number of antenatal visits (given as ante_visit in Figure 1) are surrounded by other villages with similarly high (low) number of antenatal visits. A negative Moran’s I statistic indicates a negative spatial autocorrelation where villages with a high (low) number of antenatal visits are surrounded by other villages with low (high) number of antenatal visits. The positive Moran’s I statistic of 0.170911 shown in Figure 2 indicates that there is positive spatial autocorrelation, implying that women’s behaviours in each village may be influenced by other women’s behaviours in surrounding villages.

