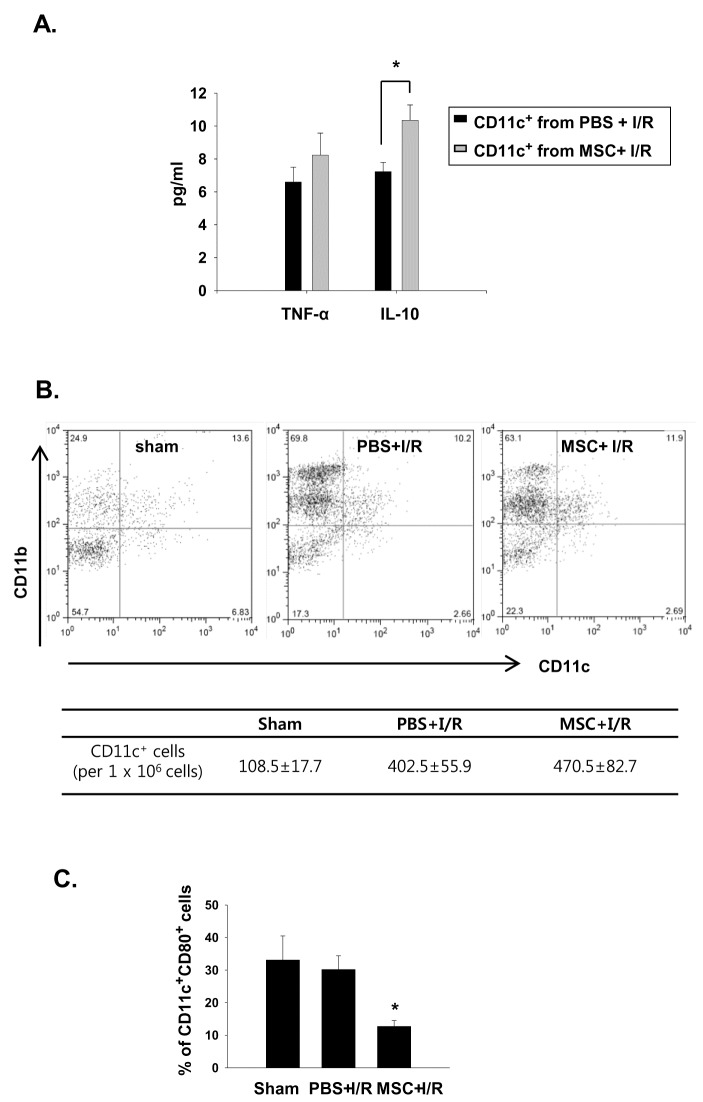
Figure 5. CD11c+ cells in the MSC-treated I/R mice showed phenotypic changes.
The mice were pretreated with 106 MSCs or vehicle (PBS) for 4 h before I/R. The mice were then sacrificed and analyzed. (A) Cytokine production from the spleen CD11c+ cells. (B) Flow cytometric analysis and number of kidney CD11c+ cells in I/R or MSC + I/R kidneys. (C) The percentage of mature DCs (expressing CD80) in kidney CD11c+ cells. n = 5–6 per group, * p < 0.05 compared to PBS + I/R.

