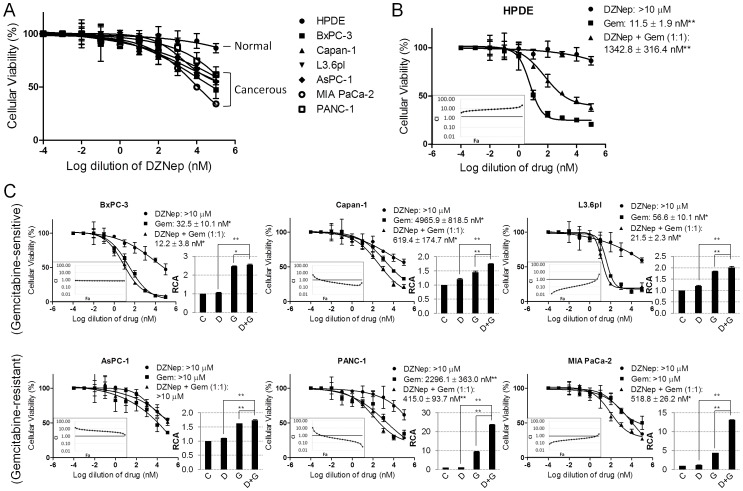
Figure 1. DZNep and gemcitabine sensitivity, singly or in combination, and interactions within a panel of pancreatic cell lines.
A. All cancerous cell lines excluding the normal HPDE are DZNep-responsive and reduced cellular viability. B. DZNep and gemcitabine displayed antagonistic effects in HPDE. C. DZNep and gemcitabine displayed additive or synergistic effects in many of the cancerous pancreatic cell lines. Twenty-four hours after 3×10³ cells/well were seeded in a 96-well plate, cells were treated with either DZNep, gemcitabine, or a combination of both at an equimolar ratio for 72 h. Cellular viability was measured using an MTT assay. Cytotoxic IC50 values are indicated. Significances between gemcitabine and DZNep as well as DZNep+Gemcitabine and DZNep were identified using one-way ANOVA followed by Tukey’s post-hoc test. Combination index (CI) plots (insets) show the interactions between the two drugs. CI>1, antagonism; CI = 1, additivity; CI<1, synergism. Bar graphs to the right indicate the relative caspase-3 activity (RCA) of each treatment as measured by fluorescence intensity. Values were background-subtracted and are presented as fold-change from the control. Significance between a single drug versus the drug combination was identified via one-way ANOVA followed by Tukey’s post-hoc analysis. Cells were treated with 1 µM DZNep, 100 nM gemcitabine, or both. Bars, SD. n = 3. *p<0.05, **p<0.01.

